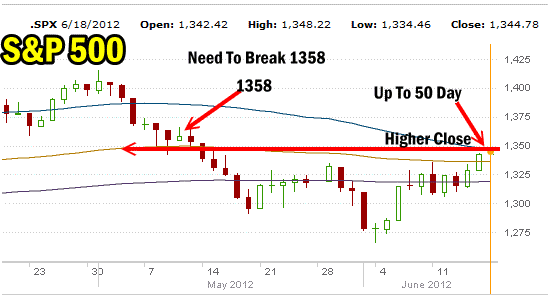
Market direction remains up, but Market timing indicators are reflecting an overbought market. That doesn’t mean that market direction is going to fall heavily from here, but it does mean that the S&P 500 may be in for some whipsawing as it tries to push higher. Combine the overbought condition with the fact that the S&P 500 has recovered to the 50 day moving average and the S&P is now pushing into heavier resistance which could see some down days.
Market Direction and The 50 Day Moving Average
The 200 day moving average was tested several times for support before market direction moved higher. The 100 day moving average was easily broken, but then normally the 100 day moving average is a yardstick measurement and not an area of support and resistance. The 50 day moving average though is an area of support and resistance.
With the S&P 500 market direction now back to the 50 day moving average those who want out of the market will sell here, at any sign of weakness in the market. With the European problems continuing to plague the stock market and the continual rise in yields for Spain and Italy, this may be enough to spook investors to get out at the 50 day moving average, especially if the S&P shows any signs of having trouble breaking through.

The market direction remains up but the market needs to break through 1358 to set itself up to challenge the May and then the April highs.
The S&P 500 market direction chart above shows that the market direction remains up and today’s close at a higher high than the May 29 high, but the market neds to break to above 1358 to set itself up for a challenge to the May and then April highs. That will be a tall order for market direction and right now market timing indicators do not support a move higher until the overbought condition is gone. I would expect any decline in market direction would not fall much below 1330. If it does then those who believe this is a bear market trap for investors could right. Myself I think the bull market is alive and well, but it is going to take a bit more time for the market direction to move higher from here.
Market Timing Indicators For June 18 2012
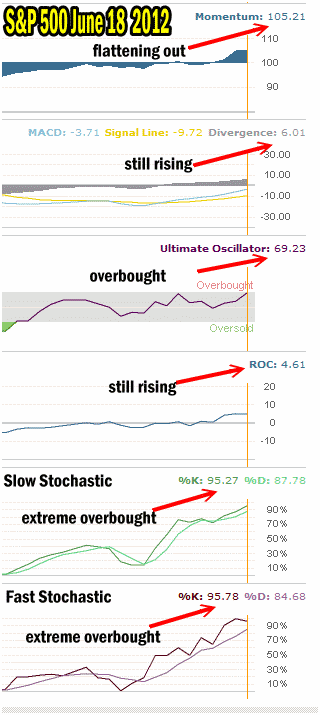
The market timing indicators are as a group, indicating overbought conditions which is why the DOW Index had so much trouble today.
Momentum is unchanged from Friday with a reading of 105.21 whereas Friday was at 105.07.
The MACD Histogram (Moving Average Convergence / Divergence) though continues to climb and is now at 6.01. It has been more than 3 months since we have had a MACD histogram reading this high. Today’s reading though still does not negate the major sell signal back in April from the MACD Histogram.
Ultimate Oscillator in one day has now pushed into overbought readings.
Rate Of Change is back positive with a reading of 4.61. That is the highest reading from Rate of Change since March 19 when the reading was 4.94. It doesn’t signal that the S&P 500 is out of the woods yet, but it is a good sign particularly with the S&P 500 back to the 50 day moving average.
The two most telling market timing tools though are the slow stochastic and fast stochastic with extreme overbought readings from both indicators.The slow stochastic looks out more than a day or two and right now with such an extreme reading it is advising that market direction could stall here or begin to move sideways to consolidate.
The fast stochastic market timing indicator is showing that despite today’s gain it is starting to turn down with a reading of %K 95.78 and %D 84.68 versus yesterday’s reading of %K99.37 and %D 75.43. Today’s fast stochastic reading is indicating a good chance the market direction may turn down from here or certainly some whipsaws may enter the market. As long as market direction does not turn down sharply the trend up will remain intact.

Market timing indicators are showing market direction could stall here as the market is into overbought territory.
VIX Reading For Today
Many investors look to the VIX Index and its readings for a market direction outlook and today the VIX reading was at 18.32 for a decline of 13.21% from Friday’s close. A lot of investors will be looking at that drop in the VIX as a signal to consider entering stocks in the next pull back.
Market Direction and Market Timing Summary For Monday June 18 2012
With strong overbought readings from the Ultimate Oscillator, Fast and Slow Stochastic in market timing, market direction may stall here at the 50 day moving average. Certainly no large decline is being signalled but a slowing of the rally will probably take place.
Meanwhile the other market timing indicators are split, with the Momentum indicator flashing a sideways signal and rate of change and the MACD Histogram pointing to the market direction to continue to move higher. The readings from rate of change and MACD are somewhat high for this early into the rally which reflects how many investors have jumped on board last week. I would not expect these high readings to continue in either indicator whether market direction moves sideways or up from here.
My market direction outlook based on the general consensus of the market timing tools is for market direction to remain with a bias up but probably some pullback or at least a sideways move for a few trading sessions may be in the cards for the next couple of days. With that in mind I have my watch list of stocks at the ready and I have kept an eye out for some put selling chances. Today I sold naked puts on Bank of Montreal Stock for July $54 for .76. I am sure other opportunities will show up shortly.
