
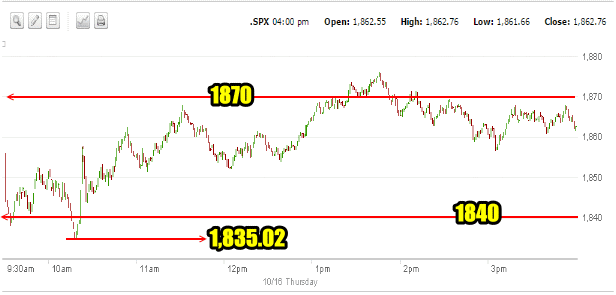
The Market Direction for Thursday was for stocks to attempt a rebound rally. Instead, earnings warnings from Walmart and Ebola concerns continued to rock investors and the market opened with a thud. The futures showed that the market was going to open a long way down but instead selling was muted despite being down to 1835 within an hour of the open. At 10:37 came word that St Louis Fed President James Bullard suggested that Quantitative Easing could be extended beyond October’s expiry. This suggestion stabilized the selling and brought the markets back up. Let’s take a look at today’s action.
SPX Market Direction Intraday 1 Minute Chart
The action for today shows the early morning drop caused by the continuing Ebola scare as well as Walmart’s earnings warning. By 10:30 the low was in when Fed President Bullard’s suggestion came across the media and the market turn around. By early afternoon the market broke through 1870. This was a rise of over 35 points on the SPX and was an obvious attempt to stall the selling that by Wednesday had reached panic status with the VIX Index up the highest level in more than 2 years and 6.1 billion shares traded, one of the highest volumes in over a year. The rest of the afternoon stocks drifted sideways and closed almost unchanged at 1862.76.
SPX intraday Oct 16 2014
Advance Declines For Oct 16 2014
Wednesday was one of the highest volume days this year with more than 6.1 billion shares traded. On Thursday that volume dropped off to a still strong 5.07 billion shares traded. 68% of all issued were advancing. There were 21 new highs and 176 new lows which was quite a contrast from yesterday’s 594 new lows.
Market Direction Closings For Oct 16 2014
The S&P closed at 1862.76 up 0.27. The Dow closed at 16,117.24 down 24.50. The NASDAQ closed at 4217.39 up 2.07
The most important index again today was the Russell 2000 which closed up 1.27% at 1,086.11
Market Direction Technical Indicators At The Close of Oct 16 2014
Let’s review the market direction technical indicators at the close of Oct 16 2014 on the S&P 500 and view the market direction outlook for Oct 17 2014.
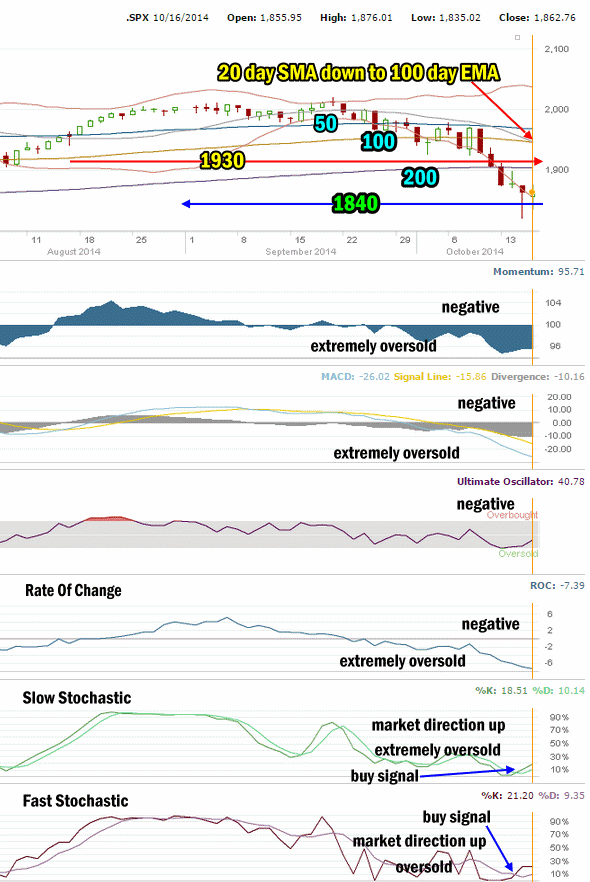
Market Direction Technical Analysis for Oct 16 2014
Stock Chart Comments: The most important event today was the recovery which was primarily caused by the comments from Fed President Bullard which were obviously designed to calm investors. The 20 day simple moving average (SMA) today fell to the 100 day exponential moving average (EMA) but did not cross over it. Tomorrow if the 20 day SMA moves sideways it will be a signal that the rally has more upside in it.
Strong Support Levels are at 1870 and 1840. Both levels are strong enough to delay the market falling. Today the market managed to once again hold stocks above the 1840 level.
The other two support levels not shown in the chart above are 1775 and 1750. I have explained that these two are critical support for the present bull market. While 1775 is important it is 1750 that is now the bottom line.
A break of 1750 would mark a severe correction of more than 13% from the most recent high. This would be the biggest correction since April 2012. A pull-back of that size would definitely stun investors at this point and it is not something I am anticipating at this time. That however could change if the selling intensifies. Today’s reversal from morning opening plunge would seem to indicate that 1750 may not be tested or reached, over the short-term although this bounce was orchestrated by the Bullard’s comments.
Momentum: For Momentum I am using the 10 period. Momentum has been the best indicator, replacing MACD as the most accurate indicator. Momentum is negative and extremely oversold.
MACD Histogram: For MACD Histogram, I am using the Fast Points set at 13, Slow Points at 26 and Smoothing at 9. MACD (Moving Averages Convergence / Divergence) issued a sell signal on Sept 10. MACD is negative and extremely oversold.
Ultimate Oscillator: The Ultimate Oscillator settings are: Period 1 is 5, Period 2 is 10, Period 3 is 15, Factor 1 is 4, Factor 2 is 2 and Factor 3 is 1. These are not the default settings but are the settings I use with the S&P 500 chart set for 1 to 3 months. The Ultimate Oscillator is negative but no longer oversold and is continuing to rise.
Rate of Change: Rate Of Change is set for a 21 period. Today the rate of change fell lower and is extremely oversold. With levels this low almost always a rally will commence.
Slow Stochastic: For the Slow Stochastic I use the K period of 14 and D period of 3. As the Slow Stochastic tries to predict the market direction further out than just one day. The Slow Stochastic is signaling market direction is up and it has issued a buy signal yesterday. It is extremely oversold.
Fast Stochastic: For the Fast Stochastic I use the K period of 20 and D period of 5. These are not default settings but settings I set for the 1 to 3 month S&P 500 chart when it is set for daily. The Fast Stochastic is still signaling up and it too had a buy signal yesterday. It is oversold.
Market Direction Outlook And Strategy for Oct 17 2014
The only concern today was that the rally back from the morning plunge was primarily a direct result of Fed comments from St Louis Fed President James Bullard. Manipulation of this sort has gone on since I started investing in the 1970’s and has been around since stock markets were invested. The government is probably the biggest market manipulator there is and today was another sign. Basically the selling yesterday alarmed a lot of people. By his reported suggestions on extending Quantitative Easing I think Bullard was trying to calm markets and advising investors that the Fed is watching and remains accommodative. Whether anything significant will actually come about is immaterial at present. I believe it was just an attempt to ease the sell-off.
But selling today in the morning was far less than yesterday’s plunge in the early afternoon. The VIX Index by the close had fallen back to $25.20 which is still incredibly high but does indicate investors are calming down.
Weekly Initial Unemployment Insurance Claims
Meanwhile today we got the Weekly Initial Unemployment Insurance Claims which showed the lowest level in 14 years. This confirms the labor market continues to heal and while a lot of investors ignored the results, the Labor Department remarked that the decline of another 23,000 jobless claims which marked the lowest level since April 2014, also was intriguing since the population of the country has grown considerably since 2000, meaning that a decline of this size in 2014 shows just how strong the labor market has been. This signals to investors that staying invested should pan out based on the market timing system designed around the Weekly Initial Unemployment Insurance Claims which can be read here.
Rebound Rally
Tomorrow I am expecting the rebound rally to attempt to jump-start itself once again but just as last night Walmart hurt the opening today, tonight Google earnings and revenue while still decent, failed to meet expectations and the stock moved lower by about 3 percent in after hours trading. This may weigh on stocks on Friday. Still, I think there is a very good chance the stochastic indicators are correct in their buy signals and the Rate Of Change is so low that almost always a bounce can be anticipated. Bullard’s comments may have stalled the sell-off but it may also be just a respite for a day and more selling could emerge. My bet is on another attempt to push above 1870 and hold above it for Friday into the close.
For USA Members remember to check the Market Trend for trade changes.
Stay FullyInformed With Email Updates
Market Direction Internal Links
Profiting From Understanding Market Direction (Articles Index)
Understanding Short-Term Signals
Market Direction Portfolio Trades (Members)