
Obviously history did not repeat itself today. The day after Memorial Day is usually positive but the last week of May is usually negative. It should be an interesting week considering today was negative. While I would like to think that the week might buck history and be positive, that does not seem to be the case.
Advance Decline Numbers for May 26 2015
Volume picked up today reaching 3.3 billion shares which lately has become average for the market. With a down day as big as we saw today I would have thought volume would have really jumped. Obviously a lot of investors are rather “ho-hum” about the decline figuring it is just another one day decline. 86% of the volume was to the downside and only 14% was up. New lows reached 76 while new highs were just 29. This marks the first time in a while when new lows are moving rapidly toward 100. Once new lows reach 100 the downside action will increase. I am not so sure that “ho-hum” is the right attitude for today’s decline.
Market Direction Closings For May 26 2015
The S&P closed at 2,104.20 down 21.86. The Dow closed at 18,041.54 down 190.48. The NASDAQ closed at 5032.75 down 56.61.
Market Direction Technical Indicators At The Close of May 26 2015
Let’s review the market direction technical indicators at the close of May 26 2015 on the S&P 500 and view the market direction outlook for May 27 2015.
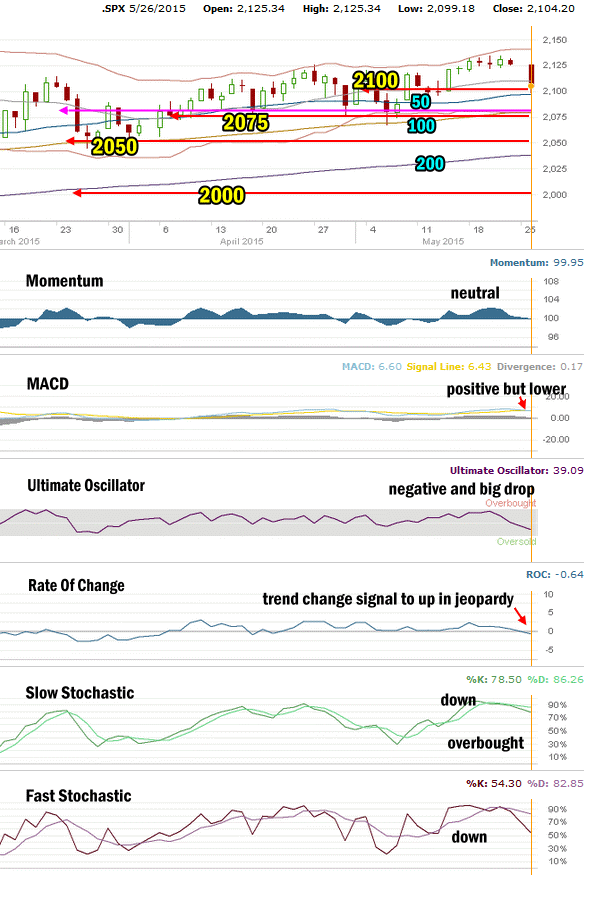
Market Direction Technical Analysis for May 26 2015
Stock Chart Comments:
Today’s drop in the S&P easily fell through to reach 2100. The low today was 2099.18 which was the 50 day simple moving average (SMA). This immediately saw buyers step in. The recovery though was slight with the S&P closing off the lows but only to 2104.20. The drop today shows that there is no support above 2100. Even support at 2100 is light and will break is sellers pile in. But presently you can see in the chart above that today’s decline is still above the most recent decline. This keeps alive the pattern of higher lows which is important.
Support and Resistance Levels:
These are the present support and resistance levels.
2100 is very light support. Stocks will have to stay above it to change it back to solid support and convince investors that the market has staying power and will push well beyond 2100. That still does not appear to be the case.
2075 is light support. Below that is 2050 which is also light support. Stronger support is at 2000 which has repeatedly held the market up throughout each pullback in January and February.
Weak support is at 1970. Stronger support is at 1956.
1870 and 1840 are both levels with strong enough support to delay the market falling and should see a sideways action attempt while investors decide whether to sell or buy.
The other two support levels are 1775 and 1750. I have explained that these two are critical support for the present bull market. While 1775 is important it is 1750 that is the bottom line.
A break of 1750 would mark a severe correction from the most recent high. This would be the biggest correction since April 2012. A pull-back of that size would definitely stun investors and bring to question whether the bull market is finished.
Momentum: For Momentum I am using the 10 period. Momentum turned neutral today with the drop in the market. A drop of 1.03% should have pushed momentum into a negative reading but instead momentum was truly not all that bad so the day ended with a neutral stance.
MACD Histogram: For MACD Histogram, I am using the Fast Points set at 13, Slow Points at 26 and Smoothing at 9. MACD (Moving Averages Convergence / Divergence) issued a buy signal on May 14. The buy signal is still being held by the S&P but it is ready to turn negative.
Ultimate Oscillator: The Ultimate Oscillator settings are: Period 1 is 5, Period 2 is 10, Period 3 is 15, Factor 1 is 4, Factor 2 is 2 and Factor 3 is 1. These are not the default settings but are the settings I use with the S&P 500 chart set for 1 to 3 months. The Ultimate Oscillator fell dramatically today and closed negative.
Rate of Change: Rate Of Change is set for a 21 period. The rate of change moved lower today. This increases the odds that the signal is changing to down for stocks.
Slow Stochastic: For the Slow Stochastic I use the K period of 14 and D period of 3. The Slow Stochastic tries to predict the market direction further out than just one day. The Slow Stochastic is signaling down for stocks and issued a sell signal at the start of today.
Fast Stochastic: For the Fast Stochastic I use the K period of 20 and D period of 5. These are not default settings but settings I set for the 1 to 3 month S&P 500 chart when it is set for daily. The Fast Stochastic is signaling down for stocks and it too issued a sell signal to start the day today.
Market Direction Outlook for May 27 2015
I had though history would repeat itself today and the market would close up. But Fed comments helped to dump the market. With today out-of-the-way, this leaves just 3 more trading days and no Memorial Day bounce. The final week of May historically is poor for stocks. The technical indicators are also pointing to more downside for stocks on Wednesday.
I would expect some kind of rebound attempt but in general there are no indications yet in the market that a bounce is in the works. Instead the indications are that stocks have further to fall. The next support level is 2075. Each pullback I have expected to see stocks move lower than 2075 but since mid-April that has not been the case. I would love to say that this time is different but until there are clearer signals, all I can say is that stocks look set to move lower on Wednesday. I am expecting 2075 to be revisited yet again and I think stocks are truly due for a correction but then I have thought a correction has been in the works for some time now and that has not yet happened.
Summer months tend to surprise investors either up or down. This time I think the surprise will be down. Today’s volume picked up but certainly showed no signs of worried investors entering the market. That could be bad for stocks later this week.
For Wednesday then I am looking for a negative close. While I think a bounce is possible I don’t think it is probable, after looking at the technical indicators. Even if we get a bounce on Wednesday I think the outlook is poor for stocks this week.
Stay FullyInformed With Email Updates
Market Direction Internal Links
Profiting From Understanding Market Direction (Articles Index)
Understanding Short-Term Signals
Market Direction Portfolio Trades (Members)