
The outlook for Tuesday was for stocks to continue their journey lower. With fear rising over the declining Euro and a “super-charged” US dollar, stocks started the day by selling off in Europe. By the time North American markets opened, the selling was immediate and steady.
Advance Decline for Mar 10 2015
Volume on Tuesday rose to 3.7 billion shares which was still below Friday’s 3.86 billion. However 86% of all volume was to the downside. There were just 21 new highs but 126 new lows. On Friday, the other most recent down day new lows were just 50. The number of new lows is among the highest since the start of January and shows the concern investors have this time around.
Market Direction Closings For Mar 10 2015
The S&P closed at 2044.16 down 35.27. The Dow closed at 17,662.94 down 332.78. The NASDAQ closed at 4859.79 down 82.64.
Market Direction Technical Indicators At The Close of Mar 10 2015
Let’s review the market direction technical indicators at the close of Mar 10 2015 on the S&P 500 and view the market direction outlook for Mar 11 2015.
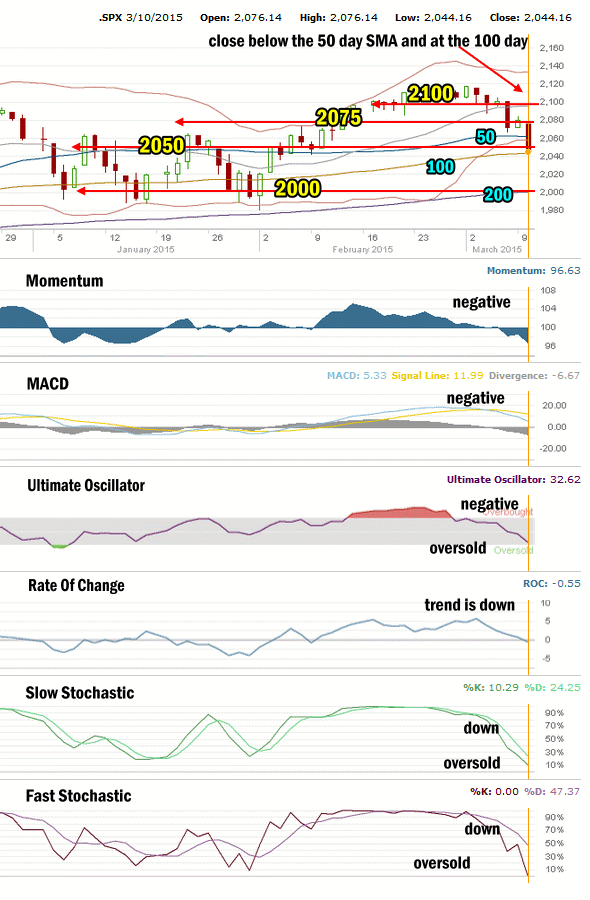
Market Direction Technical Analysis for Mar 10 2015
Stock Chart Comments:
Wiping out Monday’s gains took just a few minutes on Tuesday as stocks dumped early in the morning. They broke through the 2075 support line easily and tested the 2050 support in the morning. Volume was not huge but definitely higher than Monday but some stocks slumped more than a lot of investors anticipated. By the close the S&P was below both support levels and sitting at the 100 day moving average. Less than 50 points lower rests the 200 day moving average sitting right around the 2000 level in the S&P.
Monday at the close, the S&P looked set to fall to the Lower Bollinger Band. It did that easily today and closed below it.
Support and Resistance Levels:
These are the present support and resistance levels.
2100 was very light support and is now resistance. 2075 was light support and is now resistance. Below that is 2050 which is also light support. Stronger support is at 2000 which has repeatedly held the market up throughout each recent pullback. That may not happen this time. Weak support is at 1970. Stronger support is then at 1956.
1870 and 1840 are both levels with strong enough support to delay the market falling and should see a sideways action attempt while investors decide whether to sell or buy.
The other two support levels are 1775 and 1750. I have explained that these two are critical support for the present bull market. While 1775 is important it is 1750 that is the bottom line.
A break of 1750 would mark a severe correction from the most recent high. This would be the biggest correction since April 2012. A pull-back of that size would definitely stun investors at this point and it is not something I am anticipating at present.
Momentum: For Momentum I am using the 10 period. Momentum had turned up on Monday although it was still negative. Today momentum turned lower.
MACD Histogram: For MACD Histogram, I am using the Fast Points set at 13, Slow Points at 26 and Smoothing at 9. MACD (Moving Averages Convergence / Divergence) issued a weak sell signal on March 4. That sell signal continues to gain strength.
Ultimate Oscillator: The Ultimate Oscillator settings are: Period 1 is 5, Period 2 is 10, Period 3 is 15, Factor 1 is 4, Factor 2 is 2 and Factor 3 is 1. These are not the default settings but are the settings I use with the S&P 500 chart set for 1 to 3 months. The Ultimate Oscillator is deeply oversold.
Rate of Change: Rate Of Change is set for a 21 period. The Rate Of Change is choppy and turned lower again today. The rate of change had been warning for a couple of days that the trend up was in jeopardy. The rate of change is now signaling that the trend up is over. It is now support a move to the downside.
Slow Stochastic: For the Slow Stochastic I use the K period of 14 and D period of 3. The Slow Stochastic tries to predict the market direction further out than just one day. The Slow Stochastic is signaling lower prices are ahead and it is deeply oversold.
Fast Stochastic: For the Fast Stochastic I use the K period of 20 and D period of 5. These are not default settings but settings I set for the 1 to 3 month S&P 500 chart when it is set for daily. The Fast Stochastic is signaling down for stocks as well and it too is deeply oversold.
Market Direction Outlook for Mar 11 2015
There has been a lot of technical damage done once more in the indexes. All 3 indexes have been hurt by the selling and it will take time to recover. A move to the 200 day moving average is in the next step for stocks. The outlook for stocks is lower for Wednesday.
Stay FullyInformed With Email Updates
Market Direction Internal Links
Profiting From Understanding Market Direction (Articles Index)
Understanding Short-Term Signals
Market Direction Portfolio Trades (Members)