
The rally today was built on the back of Wednesday’s afternoon recovery rally. Comments hinting at further stimulus from the ECB’s Mario Draghi also helped fuel higher stock prices. Finally, oil rebounded $1.00 from yesterday’s 12 year low in prices. That added to some stability which also saw the US dollar weaken slightly on international exchanges.
Index Closing Prices
All the indexes closed well off their lows. The S&P closed at 1,868.99 flirting with trying to hold the important 1870 support level. The Dow Jones closed at 15,882.68 up 225.94. The NASDAQ closed at 4472.06 up just 0.37
Advance Decline Numbers
Volume came in at 5 billion shares, down from Wednesday’s 6.42 Billion shares traded. Almost 70% of trades were moving higher. There were 100 new lows which was a huge change from yesterday’s 1395 new lows. There were 4 new highs. The new lows must fall below 100 if the rally is to continue to advance with any degree of consistency.
The NASDAQ had a volume of 2.45 billion shares traded. Up volume was at 55% of all trades and new lows came in at 119. New highs were just 4. The new lows were far less than yesterday’s new lows but still being above 100 will not move the market higher for any period of time.
Market Direction Technical Indicators At The Close
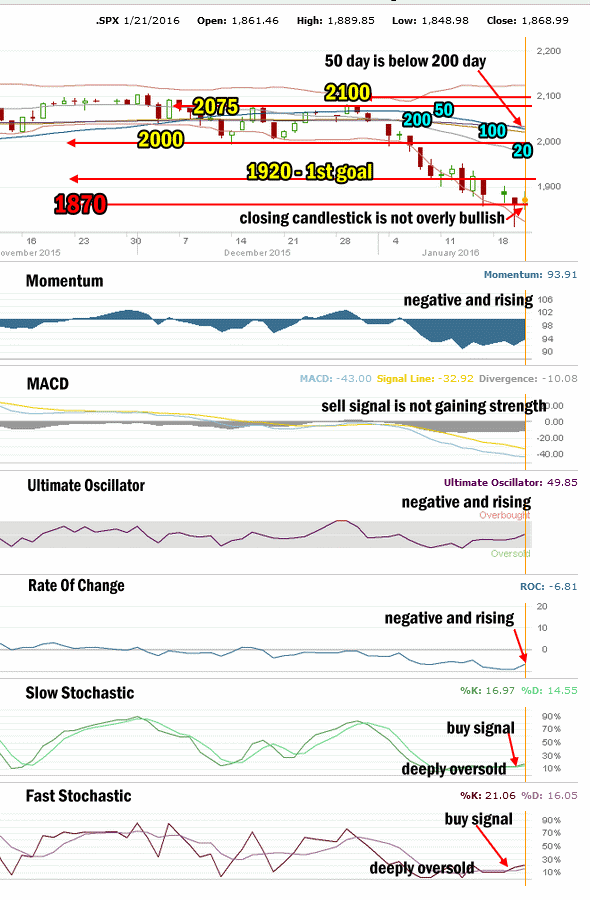
Market Direction Technical Analysis for Jan 21 2016
Stock Chart Comments:
The S&P rally today was fairly good with reasonably decent volume and the number of new lows pulled back dramatically. The 50 day simple moving average (SMA) is still falling and it is now firmly below the 200 day and ready to cross down and over the 100 day. The Upper Bollinger Band is still moving sideways and not falling. The Lower Bollinger Band is continuing to drop dramatically and not yet turning back up or even sideways.
The closing candlestick for today is not overly bullish for Friday. The S&P did manage to move above the 1880 level but closed below the 1870 levels.
Support and Resistance Levels:
These are the present support and resistance levels. These levels have not changed since January 2015. 2100 was light support. Stocks have been unable to stay above this level. It remains resistance.
2075 was light support and is also resistance. Below that is 2050 which was also light support and now resistance.
Stronger support was at 2000 which is now resistance.
Weak resistance is at 1970 while stronger resistance is at 1956 and technically it is more important than 1970 for the market. 1940 was light support and is now resistance. 1920 was light support and is also resistance. 1900 is more symbolic than anything else.
1870 and 1840 are still trying to support the markets.
1775 and 1750 are both critical support for the present bull market. While 1775 is important it is 1750 that is the bottom line.
A break of 1750 would mark a severe correction from the all-time high of 2134.72. This would be the biggest correction since 2011 plunge of 271 points for a 20% pullback. A pullback to 1750 from the all-time high would be a drop of 384 points for a decline of 18%. A pull-back of that size would definitely stun investors and bring to question whether the bull market is finished.
Momentum: For momentum I use a 10 period when studying market direction. Momentum on Thursday was negative but trying to move back up.
MACD Histogram: For MACD Histogram, I am using the Fast Points set at 13, Slow Points at 26 and Smoothing at 9. MACD (Moving Averages Convergence / Divergence) issued a sell signal on Jan 4. The sell signal pulled back slightly on Wednesday.
Ultimate Oscillator: The Ultimate Oscillator settings are: Period 1 is 5, Period 2 is 10, Period 3 is 15, Factor 1 is 4, Factor 2 is 2 and Factor 3 is 1. These are not the default settings but are the settings I use with the S&P 500 chart set for 1 to 3 months. The Ultimate Oscillator is negative but ready to turn positive.
Rate of Change: Rate Of Change is set for a 21 period. The rate of change signal is negative and extremely oversold with a signal of negative 8.94 which is commonly followed by a rally.
Slow Stochastic: For the Slow Stochastic I use the K period of 14 and D period of 3. The Slow Stochastic tries to predict the market direction further out than just one day. The Slow Stochastic issued weak buy signal at the close on Wednesday. That buy signal was still active today.
Fast Stochastic: For the Fast Stochastic I use the K period of 20 and D period of 5. These are not default settings but settings I set for the 1 to 3 month S&P 500 chart when it is set for daily. The Fast Stochastic issued a strong buy signal on Wednesday which was followed through on today.
Market Direction Outlook for Jan 22 2016
The market remains extremely oversold but there are strong signals advising that this is just a rebound with more downside still to come. For Friday, being the last day before the weekend, investors may be reluctant to pick up stocks ahead of Monday. I am not expecting the rally to continue Friday although there does not appear to be a lot of downside left for stocks on Friday either. We could see a calmer day on Friday with stocks trending more sideways than up or down. Overall though if I had to pick a side, I would pick down as the rally was nice to see and the number of new lows was definitely encouraging but it “felt” more like a calm moment in-between two storms. For Friday then the outlook is sideways but with a lower momentum outlook. At some point shortly the market may try to retest the 1820 level again.
Oil remains the wildcard for Friday. A further rebound in the price of oil on Friday could be all its takes to change the outlook from sideways and weak to sideways and up so keep a watch on oil’s movement before the markets on Friday.
Stay FullyInformed With Email Updates
Market Direction Internal Links
Profiting From Understanding Market Direction (Articles Index)
Understanding Short-Term Signals
Market Direction Portfolio Trades (Members)
Market Direction External Links
IWM ETF Russell 2000 Fund Info
Market Direction SPY ETF 500 Fund Info