
The movement today in the SPX was primarily driven by a lack of “bad news”. While the news out of China might seem poor, investors look at the report of yet another possible slowdown in the Chinese economy as a chance for them to stimulate further. Meanwhile news out of the Ukraine while not overly optimistic was not pessimistic and that too seemed to drive stocks. Finally, the fact that the market has not fallen apart over the last two days also drew in some investors, myself included.
Market Direction SPX Intraday Chart August 13 2014
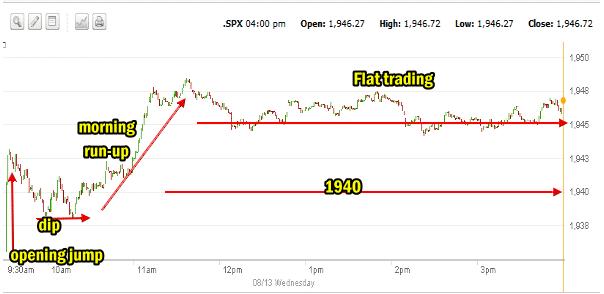
Today’s one minute intraday chart shows the flat trading day that developed. The morning saw an opening jump followed by a quick dip which lasted about half an hour. From there the market direction ran higher to just above 1948 and then turned flat for the remainder of the day. It traded in a very tight range but well above 1940. The next struggle will be to retake the important 1956 level. That will signal a move back above the 50 day exponential moving average (EMA).
Advance Declines For August 13 2014
Volume was only reasonable again on Wednesday with 2.7 billion shares traded. On that volume 67% was up. Meanwhile 72% of all stocks were advancing. There were though just 68 new highs and 29 new lows.
Market Direction Closings For August 13 2014
The S&P closed at 1946.72 up 12.97. The Dow closed at 16,651.80 up 91.26. The NASDAQ closed at 4434.13 up 44.87.
The Russell 2000 IWM ETF rose $0.88 to close at $113.44.
Market Direction Technical Indicators At The Close of August 13 2014
Let’s review the market direction technical indicators at the close of August 13 2014 on the S&P 500 and view the market direction outlook for August 14 2014.

Stock Chart Comments: The market direction is continuing to try to push back above the 50 day EMA.
1975, 1956 Support: These two support levels have been broken and will now act as resistance.
Strong Support Levels are at 1870 and 1840. The 1870 level is below the 100 day EMA so I am expecting this pullback to reach that far but a lot now depends on how strong the recovery bounce may be. 1840 is below the 200 day EMA and would mark a serious correction. A break of 1870 is a definite signal that those investors not holding Ultra short ETFs or SPY PUT Options 2 months out, should be doing so by this point for a bigger move lower.
The other two support levels not shown in the chart above are 1775 and 1750. I have explained that these two are critical support for the present bull market. While 1775 is important it is 1750 that is now the bottom line.
A break of 1750 would mark a severe correction of 180 points which is below a 10% correction from the most recent high. This would be the biggest correction since April 2012. A pull-back of that size would definitely stun investors at this point and it is not something I am anticipating as there are no signs of any impending correction of that magnitude. If stocks did get this low it would become questionable if the correction would move down at least another 5%.
My Pullback Outlook: I have been waiting for a pull-back this summer to between 1870 to 1919. The market fell to 1910 in the recent pullback last week before bouncing back on Friday. At present that may have been the extent of the drop I was anticipating.
Momentum: For Momentum I am using the 10 period. Momentum has been the best indicator, replacing MACD as the most accurate indicator. Momentum is negative and rising..
MACD Histogram: For MACD Histogram, I am using the Fast Points set at 13, Slow Points at 26 and Smoothing at 9. MACD (Moving Averages Convergence / Divergence) issued sell signal on July 8. Today the sell signal continued although it is weaker again today.
Ultimate Oscillator: The Ultimate Oscillator settings are: Period 1 is 5, Period 2 is 10, Period 3 is 15, Factor 1 is 4, Factor 2 is 2 and Factor 3 is 1. These are not the default settings but are the settings I use with the S&P 500 chart set for 1 to 3 months. The Ultimate Oscillator moved into positive readings today.
Rate of Change: Rate Of Change is set for a 21 period. Today the Rate Of Change remained negative and continued sideways.
Slow Stochastic: For the Slow Stochastic I use the K period of 14 and D period of 3. As the Slow Stochastic tries to predict the market direction further out than just one day. The Slow Stochastic is signaling market direction is up.
Fast Stochastic: For the Fast Stochastic I use the K period of 20 and D period of 5. These are not default settings but settings I set for the 1 to 3 month S&P 500 chart when it is set for daily. The Fast Stochastic is also signaling that stocks are moving up for Thursday.
Market Direction Outlook And Strategy for August 13 2014
The technical indicators are becoming less mixed. While there still are 3 negative indicators, there are also 3 positive ones and MACD and Momentum while negative as showing signs of possibly turning back up. Rate of change however is not supporting the “rally theory” yet so it bears watching.
For Thursday stocks look set to continue to climb higher as today’s close above 1940 confirmed Friday’s rally as the start of a new trend back to up. If the SPX pulls back tomorrow below 1940 that will not negate the confirmation. The S&P would have to close below 1930 to negate the confirmation that the market direction is back to up.
The only thing that could remain the wildcard in market direction is Ukraine. Should hostilities escalate again, stocks will pullback.
I did a couple of trades today but I am continuing to stay with smaller positions. My focus is more on stocks that are showing strength as they rebound from recent selling.
Stay FullyInformed With Email Updates
Market Direction Internal Links
Profiting From Understanding Market Direction (Articles Index)
Understanding Short-Term Signals
Market Direction Portfolio Trades (Members)