Market Direction from a technical perspective is often easier to follow than from a fundamental view. On April 2 for example, when the S&P 500 made its highest recovery from the crash of 2008 to 2009, the Dow Theory did not confirm the high. Over the past couple of weeks many analysts now tell investors that they knew the stock market was going to fall based on the Dow Theory not confirming the high. However analysts seem to have forgotten that while Market Direction has been down since April 2, this correction which will soon enter a third month is still shallow.
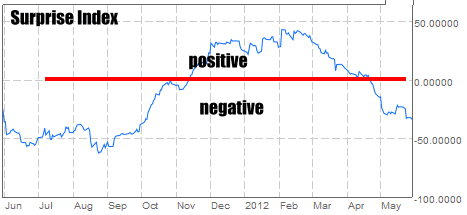
With market direction down about 9% at its worst, analysts and pundits everywhere have investors at bearish levels not seen since 2009. Last week bloggers were more than 50% bearish, the highest level since 2009 and Yale’s institutional crash confidence index was at its worst level in more than three years. Add to this the Citigroup Economic Surprise Indice which all the talking heads are now blahing about and how it is increasingly falling, signaling that the US is entering a recession again. You can see the latest Citigroup Economic Surprise Indice below which shows a steady erosion since March. Even though the market was higher in early April, the Citigroup Economic Surprise Indice has continued to fall.

Market Direction Citigroup Economic Surprise Indice Chart
In all this doom and gloom talk, it is still important to remember that the stock market cannot climb continuously. There must be set backs and pullbacks in order for the market to gather strength, test for support levels, find buyers and then move higher. The fact that this correction which has seen unprecedented bearishness is not down lower actually bodes well for stocks overall.
Don’t Short This Market Direction Instead Use Spy Put Options
Don’t get drawn into the belief that this market is in a bear stage yet. Market Direction is nowhere near bear territory yet. Be careful when taking short positions. For those who want to take the short stance, consider buying the SPY PUT OPTIONS two months out to give enough room for recovery should the market move higher. Consider using a close stop-loss of perhaps 3% to protect in case the S&P moves higher.
I hate to hold SPY PUT Options longer than a day or two at most. This is why I primarily day trade the spy put options. I don’t like to buy the spy put options when the market moves higher all day. I prefer buying the spy put options when the market is turning down. I will always miss the top when trading the spy put this way, but I rarely get caught in a move higher and I can almost always guarantee myself some size of profit by buying and selling spy puts when the market direction is clearly lower and right now that is not the case.
The Case For Bullish Market Direction
It’s important to stop listening to what every talking head is repeating and look at the case for the bulls. Market Direction is down not 10% and certainly no where near where it was last summer when it appeared the bear market had returned. Europe looks like it is imploding, US housing statistics are still terrible, employment appears to be slowing, China and Japan look like they are slowing down as well. But the S&P 500 index is only down 9% at its lowest so far.
This is not yet a market to go short on. Yesterday’s market direction and market timing comment indicated that the day after memorial day has been positive for the market direction on 17 of the last 25 years.
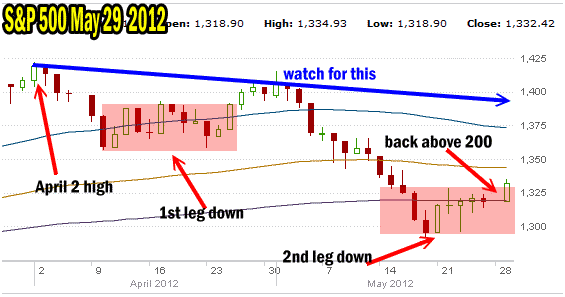
Today the S&P 500 has found itself back above the 200 day moving average.

Market Direction On The S&P 500 shows a lot of strength still exists despite the selling over the past two months
Market Direction Is Always The Key
Looking at the above chart I have drawn in blue the line to watch. The chance of the S&P 500 reaching back to around 1385 is I believe small at this point, but should it get that high it must break through. If it does then it must move higher than 1415 which was the May 1st high. The second leg down which you can see in the chart above could be on the verge of preparing to try to challenge the 100 day and then fall lower than the 200 day.
Market Direction At The 100 Day
If the S&P 500 can reach the 100 day but not break through I will be buying spy puts again as that will definitely be bearish for the overall stock market. The second leg down was worse than the first and that was to be expected in a correction. But the second leg down has also spooked many investors and with many stock markets around the world down a lot more than the S&P 500 there is significant room for the S&P to fall below the 200 day. The 100 day in my book is a vital link in this bull market. Already the 100 day moving average was broken through easily. Now the S&P 500 must regain the 100 day or the 3rd leg down in market direction will move lower and be worse than the 2nd leg down. If there is a third leg lower it will make a lot of profit for those holding short positions like the Spy Put Options, which will be my choice.
Selling At the 200 Day
You can see that in the second leg down, with the first break of the 200 day moving average, sellers stepped up and started to unload stocks. Buyers appeared and pushed the back to above the 200 day. If the 100 day is not captured soon those buyers will move lower than the 200 day moving average which is exactly what happened in the first leg down. In that market direction move lower, the 50 day had some support but the constant retesting of that support meant the 50 day would break. I wrote an article explaining how this is just simple investing. I wrote about this on May 8 and again on May 12. It makes a lot of sense. Why would you buy a stock today for $50.00 if you thought you could soon get it for $40.00. Market corrections are not rocket science but simple buy and sell principles and if a stock is going to have a fire sale most investors see no reason to buy it today when they expect it will be cheaper tomorrow.
Market Direction First Leg Down
In the first leg down buyers picked up stocks at the 50 day level which was 1350. But the market refused to bounce so buyers dumped their shares and moved lower. For buyers to be interested in stocks there has to be upside and the market direction refused to move higher in the 1st leg down. It was obvious to seasoned investors that they had bought at the wrong time and so they dumped shares and moved lower waiting for market direction to move lower.
Market Direction Second Leg Down
The second leg down though has been different. The S&P 500 plummeted through the 100 day moving average like it did not exist and then fell through the 200 day on good volume. That volume saw a lot of panic selling. Since then the second leg down has seen the market direction shift back to up and the stock market grind slowly higher. The first leg down saw no recovery but an erosion that grew daily as market direction refused to move up. This second leg down in the present correction did not have that erosion but has seen stocks claw their way higher. This is what buyers want to see. They bought when the market fell on May 18 and May 21. Now they want to see the market push higher. They will unload their shares at any sign of trouble and market direction will sharply reverse and fall.
If that happens I believe the 200 day will easily break.
Market Timing Technical Analysis for May 29
After today’s market close despite the market direction back up and the over 1% gain in the S&P 500, the market timing indicators are still concerned about market direction moving higher.
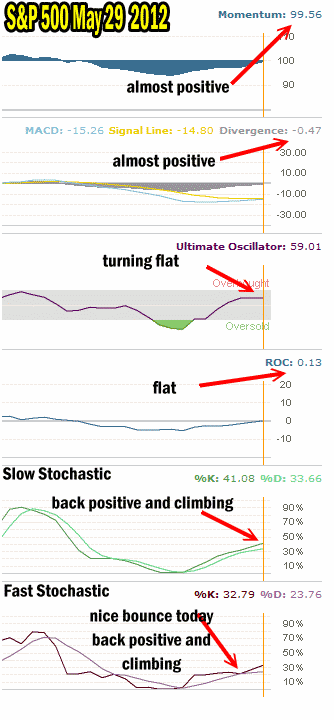
Momentum is up just slightly despite today’s big up day. It is still slightly negative but today’s strong market direction up move I would have liked to have seen the momentum indicators back positive. Instead they are reflecting the hesitation among investors even after today’s rally and that would hint that weakness may be coming tomorrow or Thursday.
MACD has improved and it is not so much turning positive but is more flat than anything again a sign of indecision among investors.
The Ultimate Oscillator is reflecting that indecision as it has turned flat. Not down mind you, but certainly flat.
Rate of Change is flat which confirms the Ultimate Oscillator, MACD and Momentum indicators.
Slow Stochastic is continuing to climb and still signals market direction up.
Fast Stochastic which in my last market timing column was signalling a sell signal on Friday had a nice bounce off that sell signal which you can see in the graph below and is now signalling market direction up.

Market Timing Technical Analysis for May 29 2012 still shows the S&P is not out of the woods yet.
Market Direction Summary
The S&P 500 is back to the point of caution as it has climbed from May 18. With only two indicators showing that the market direction is still up, I remain skeptical of the recent move up. The first four market timing indicators are warning that the indecision among investors remains and the market rally since May 18 while a grinding one at best, may be ending.
Be careful when shorting the market here. Any good news out of Europe could send stocks surging and while the longer term direction may still be down, the mid or short-term could be up and if you are caught holding spy puts without a stop-loss or shorting the overall market, should the market direction turn up dramatically, most investors will dump their short positions and take losses to get out as they will fear that the move higher might be sustained.
I prefer to stay with the approach of only holding spy put options when the market direction is clearly down.
Presently the stock market outlook is wait and see. Market direction up today was great to see but I already explained yesterday that historically today’s up move was expected. Now we need to see if market direction will hold and continue to climb and even if it does it still must surpass the highs of May 1. Right now in the present Euro mess I am skeptical that market direction can be sustained higher.
