Market direction is always a best guess but the technical indicators can often tell investors where the market direction may be heading. Yesterday’s market pullback brought the market to the August lows. The S&P 500 broke the August lows. Market direction is clear. It is still down.
This morning’s market direction again was clear and the action was interesting in that all the market’s easily fell through the August lows before recovering. Is this a sign of a bounce or is it just a technical bounce and those buying back positions. I would place the odds that there will be strength at this level as perhaps 40%. I would place the odds of market direction changing as probably 10%.
The problem any market faces is when a market direction changes and the markets fall as they did on August 8 and sets a strong low, which it did, investors jump in and buy convinced that the market has overdone itself and stocks are cheap. The news is filled with talk about how cheap stocks are and institutional fund managers as well as pension fund managers are no different from individual investors. They are looking for value at better prices. However looking at many stocks are the majority undervalued? I don’t believe so. I also believe that the market having continual shorter and shorter rallies is also telling investors the same thing. Stock as a whole may be fairly valued, but not undervalued.
For stocks to become undervalued they need to have fire sale prices. This happened in 2000 to 2001 and in 2008 to 2009. Those are fire sale prices. Therefore while buying stocks is the focus of most investors, I think they need to ask what is going to change the market direction. That is after all the most important part of buying stocks. The overall market direction has to change, otherwise, why buy stocks if tomorrow or next week they will be cheaper? Market direction then is the single most important factor for those interested in buying stocks and reaping big profits as they rise. But there has to be a catalyst to drive prices back up. Until that catalyst appears and is solid, the market can rally and pullback and rally some more, but overall the market direction will remain the same – down.
The catalysts I believe have to be an increase in employment, a floor under housing and a solution, no matter how bad, to the European situation. Each one of these will help to drive the market direction from down to up. These then are the indicators I am following.
Market Direction – The Charts Say Lower Still
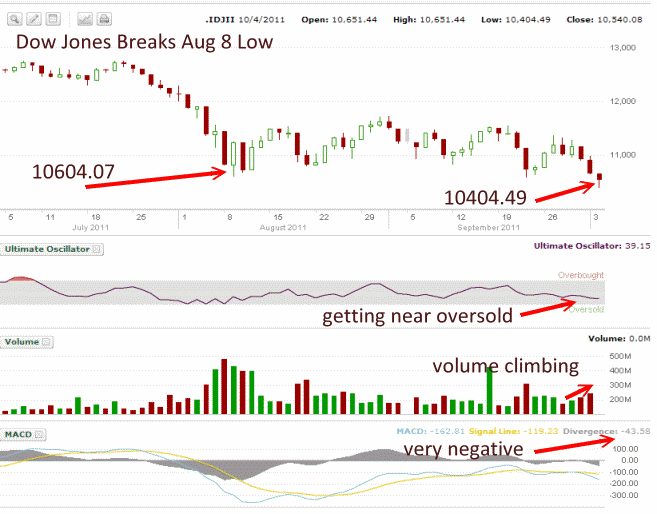
Below is the Dow Jones Chart for Oct 4. I have marked the August 8 low of 10604.07. Today within half an hour of the open the Dow was already down 200 points lower. The Ultimate Oscillator while indicating that the market is getting close to oversold, still has more room to fall before giving a clear oversold sign.
MACD which is Moving Average Convergence / Divergence indicator, is very bearish at negative 43.58. Over the past three sessions volume is picking up as the market moves lower. Only one day (green) saw accumulation. The other days (red) are distribution, meaning more investors want to sell than buy, which of course means a lower market.
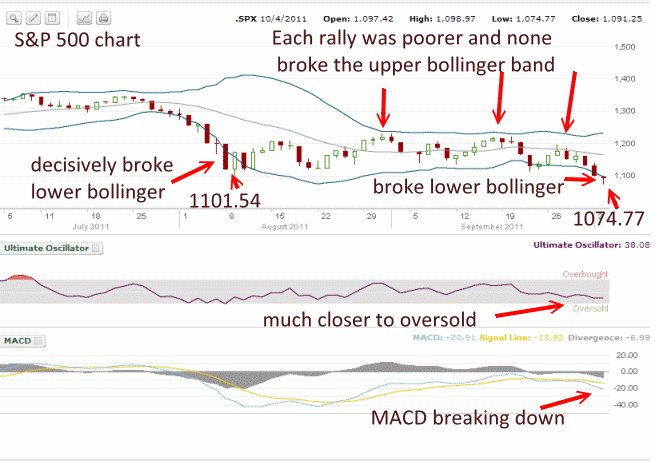
The S&P chart below is somewhat worse and again market direction is clear. The S&P 500 in early August broke the lower Bollinger. This normally means that the lower Bollinger will be tested and possibly broken again in the near future, usually within 3 months. In late September the lower Bollinger was tested and again yesterday. Today the market broke through the lower Bollinger. At the time of writing this the S&P is sitting at the lower Bollinger.
Whether it managed to close above the lower Bollinger today probably won’t matter. The indicators all say Market Direction is still down. Each rally has been poorer. Conviction of buyers was dropping with each rally. The last rally was the worst which indicates that the market would move lower. The Ultimate Oscillator is close to oversold but there is still room for the market to fall lower first. MACD while negative is actually showing that more selling is ahead as the divergence is widening to the downside, again support the market direction call for more downside before a bottom may be put in place.
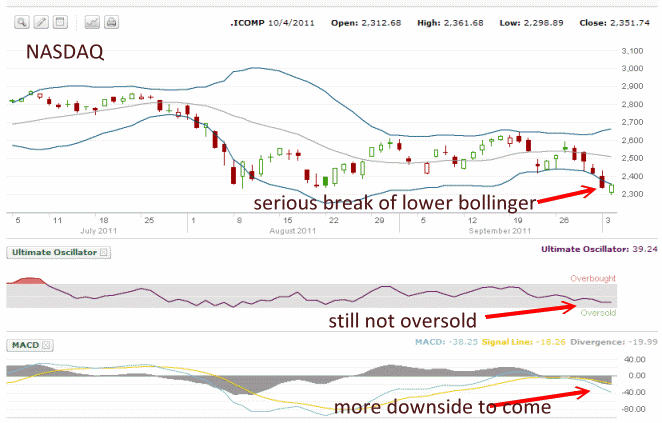
Finally let’s look at the market direction for the NASDAQ. Both yesterday and today the NASDAQ broke through the Lower Bollinger and seriously. The Ultimate Oscillator still shows more room to fall before it reaches oversold. MACD is warning that the divergence is pointing to more selling and a lower low ahead.
At the time of writing this article, 12:00 PM on Oct , the NASDAQ is up 28 points, but the little rally up is not being reflected in any of the technicals below which tells me that it is just a bounce. The market direction is clear also on the NASDAQ, lower.
Market Direction Summary
I posted my summary early as I while I do believe there could be a bounce, it would be just a chance to sell stocks and prepare for more downside.
The market direction of down is clearly being signalled by all the above indicators. For the contrarian, the fact that so many blogs are bearish could be an indicator that we are nearing some sort of bottom. Everyone knows that the majority are never right. You can view the latest market direction sentiment here. There is not one chart that shows the market might hold at this level and market direction change for the better.


