FullyInformed.com

MACD Issues Sell Signal and Market Timing Indicators Confirm It

May 4, 2012 | Stock Market Outlook

MACD Histogram or Moving Average Convergence / Divergence is a unique and powerful tool that is used by many market timing systems including my own. I have used this tool since it was first introduced by inventor Gerald Appel in the late 1970’s. What is unique about this oscillator is that it is a trend follower made up of moving averages and momentum. MACD has kept me safe in many of the worst market environments. The histogram that can be used with MACD can be used to spot turning points in markets and stocks for entry and exit positions.

It is straight forward and easy to use MACD and as it offers trend following and momentum it makes a great tool to add to my overall stock market timing tools.

MACD Fall 1987 Sell Signals

For example in fall 1987 MACD warned that the market may be on the verge of a pullback. There is no way that it could predict the size of the pullback but then I don’t believe anyone or any tool can. The chart below shows the 1987 warnings and the subsequent 25% collapse of stocks.There were two sell signals and two buy signals generated. The last buy signal was excellent for a short-term bounce back in stocks.
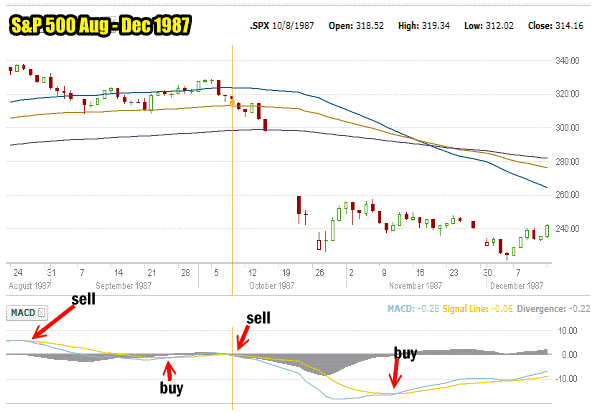
In Fall 1987 MACD issued a sell signal before the market collapse

In Fall 1987 MACD issued a sell signal before the market collapse

 MACD APRIL 4 2012 Sell Signal

On April 4 MACD issued a sell signal as the signal line (yellow in my chart below) had a higher reading than MACD. The Signal Line reading was 13.58 while MACD was 12.03. The divergence was negative 1.55 marking a definite downturn.
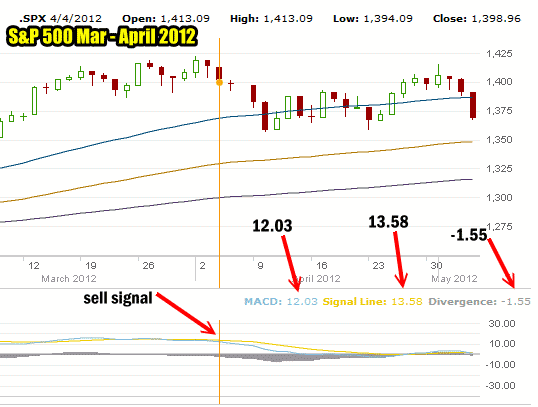
MACD sell signal generated on April 4 2012

MACD sell signal generated on April 4 2012

On April 27 the trend changed with a MACD reading of 1.24 and a Signal Line of 0.25 creating a positive divergence reading of 0.99.
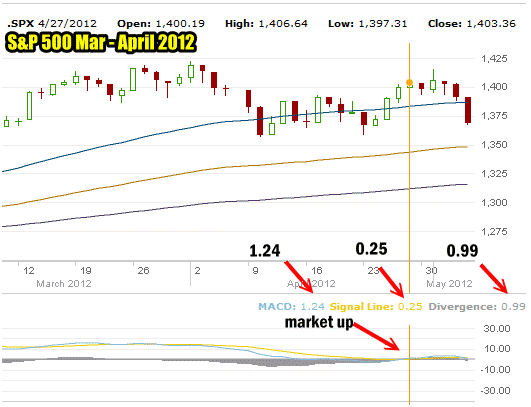
MACD Market Up Call On April 27 2012

MACD Market Up Call On April 27 2012

Today May 4 MACD generated another sell signal. The sell signal being so close to the previous market up signal, makes this sell signal important. Normally this marks a top, whether it is short-term or longer but it is very rare when the market can come roaring back up and recover to new highs. As well the fact that the Dow Jones set broke the high of 2007 and did not confirm it with any kind of follow through is in my opinion very bearish.
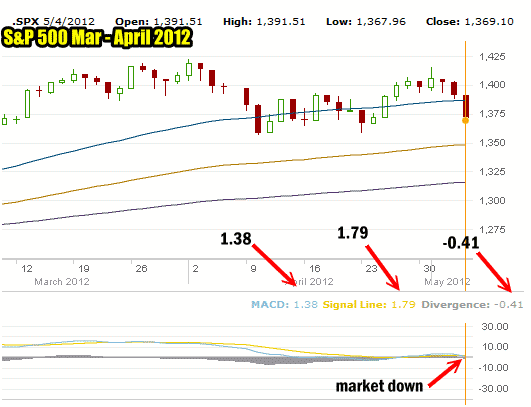
MACD Market Down Call Generated May 4 2012

MACD Market Down Call Generated May 4 2012

MACD Used For Sell In May Theory

MACD is the principal timing tool used for the Sell in May theory which indicates that investors who are in stocks from the period of Nov 1 to April 30 fare better than those who were in from May 1 to Oct 31. Indeed a study done by Trader’s Almanac concluded that an investor who had placed $10,000 in the market in 1950 and stayed only for the November to April period would have about $600,000. At the same time an investor with $10,000 who invested only in the period from May to October since 1950 would today have $9621.00.

It should be pointed out that the period of November 1 to April 30 are not exact dates but are governed by a reading from MACD which tells the investor when to move back into stocks when the sell signal or buy signal is generated. It should also be noted that there was no study done of how well this investor would have fared by staying in the market during the entire time period.

MACD Sell Signal Summary

There are of course other factors to consider including that this is an election year and historically election years have decent summer periods and a poor April. Indeed April was poor this year and perhaps stocks will get a reprieve from the Sell In May theory. However as I indicated in yesterday’s market timing column, the market recently has seen too many stocks making 52 week highs. This is typical of a bull market drawing to a close as investors pile in at the end rather than back in October or November of 2011 when stocks looked poised to fall lower.

I will put up my market timing indicators tomorrow but they confirm what MACD is signalling. I felt there is enough indication in MACD, the number of new highs, the inability of the Dow to confirm the recent new high and the inability of the NASDAQ to continue moving higher even with the recent strong earnings from Apple and Amazon. With most of the earnings now in for the quarter we have a few months ahead with little earnings news. Many stocks in my opinion are not cheap. I can name many of them including Coca Cola Stock, Amazon Stock, YUM Stock, Priceline Stock and even PG Stock is pricey. A correction of 10 to 15 percent at this stage could set the market up to move higher later into the year.

While MACD could easily change signals within a few days, the markets themselves must regain too much momentum in too short a time to prove that this period of weakness is nothing more than a hiccup. I would prefer to be cautious and follow the advice given out by MACD.

Search

Select to view all results...

Generic selectors
Exact matches only
Search in title
Search in content
Post Type Selectors

Recent Outlooks

Stock Market Outlook for Fri Apr 19 2024 – Deeply Oversold – Bounce Likely – Higher Close

Prior Trading Day Summary: Thursday saw another morning bounce attempt but no follow through. However the SPX did not break below 5000 and managed to close at 5011 although minutes before the close it was 5020 which would have turned …

Morning Investing Strategy Notes for Thu Apr 18 2024

For FullyInformed Members the morning Investing Strategy Notes for Thu Apr 18 2024 discuss the outlook for Thursday and a possible bounce or a move lower. There are trade ideas outlined in Netflix Stock (NFLX), American Express Company Stock (AXP) …

Stock Market Outlook for Thu Apr 18 2024 – Deeply Oversold – Bounce Attempt Expected

Prior Trading Day Summary: Wednesday saw a bounce attempt at the open which managed to reach 5078 before selling once again pushed stocks lower. By 12:45 stocks looks almost ready to break below 5000 but managed to find buyers who …

Morning Investing Strategy Notes for Wed Apr 17 2024

For FullyInformed Members the morning Investing Strategy Notes for Wed Apr 17 2024 discuss the outlook for a potential bounce on Wednesday. There are trade ideas outlined in Las Vegas Sands Stock (LVS), Alcoa Stock (AA), Discover Financial Stock (DFS) …

Stock Market Outlook for Wed Apr 17 2024 – Another Bounce Attempt

Prior Trading Day Summary: Tuesday found stocks stuck in a fairly tight trading range as investors remain worried about a potential Israeli retaliatory strike against Iran and what might be the implications. For much of the day the SPX trading …

Morning Investing Strategy Notes for Tue Apr 16 2024

For FullyInformed Members the morning Investing Strategy Notes for Tue Apr 16 2024 discuss the outlook for stocks for Tuesday and the chance of a bounce. There are trade ideas outlined in United Airlines Holdings Stock (UAL), Interactive Brokers (IBKR) …

Stock Market Outlook for Tue Apr 16 2024 – Deeply Oversold

Prior Trading Day Summary: Monday started the day as expected with a massive rally at the open and a push higher especially when retail sales came in stronger than expected. However as news continued to focus on Iran and Israel’s …

Morning Investing Strategy Notes for Mon Apr 15 2024

For FullyInformed Members the morning Investing Strategy Notes for Mon Apr 15 2024 discuss the outlook for stocks for Monday as well as the third week as a whole. There are trade ideas outlined in Goldman Sachs Stock (GS), Charles …

Stock Market Outlook for Mon Apr 15 2024 – Expect A Bounce

Prior Trading Day Summary: On Friday investors got better than expected bank earnings but sold bank stocks lower. The selling extended into other sectors until by the close the indexes were both down on the day and the week. The …

Morning Investing Strategy Notes for Fri Apr 12 2024

For FullyInformed Members the morning Investing Strategy Notes for Fri Apr 12 2024 discuss the CPI numbers released on Thursday and the outlook for stocks for the remainder of the week. There are trade ideas outlined in Progressive Stock (PGR), …

Stock Market Outlook for Fri Apr 12 2024 – All About Bank Earnings

Prior Trading Day Summary: On Thursday investors got a bit of good news. First the Weekly Initial Unemployment Insurance Claims came in lower than expected at 211,000. If the weekly numbers continue to show further weakness it should help ease …

Morning Investing Strategy Notes for Thu Apr 11 2024

For FullyInformed Members the morning Investing Strategy Notes for Thu Apr 11 2024 discuss the PPI numbers due out today before markets open. There are trade ideas outlined in Wells Fargo Stock (WFC), Citigroup Stock (C), JP Morgan Chase Stock …

Stock Market Outlook for Thu Apr 11 2024 – Weakness and Lower

Prior Trading Day Summary: On Wednesday the CPI number was higher than estimates. For many analysts it meant that the Fed would probably delay any rate cut longer than expected. Most analysts had picked June as the first rate cut …

Morning Investing Strategy Notes for Wed Apr 10 2024

For FullyInformed Members the morning Investing Strategy Notes for Wed Apr 10 2024 discuss the CPI numbers due out today at 8:30 and the 2:00 PM FOMC minutes.. There are trade ideas outlined in some portfolios. The morning Investing Strategy …