I received quite a few emails this evening and a couple of tweets wondering what I thought of the Russell 2000 Small Cap Stocks Index and whether it appeared it was going to break-out.
From the recent February sell-off low, the Russell 2000 has staged an impressive recovery. It is now up 20% since that low and today it closed at its highest point this year.
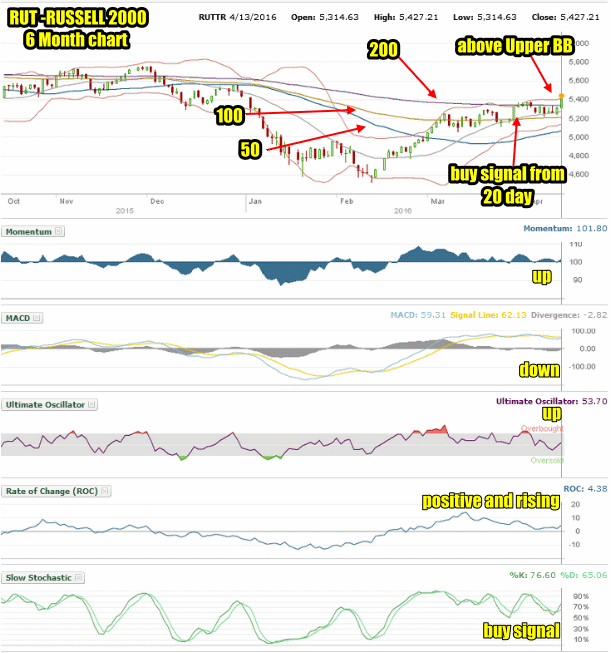
Russell 2000 Small Cap Stocks Index Chart
Looking at the past 6 months of the Russell 2000 Index, you can see the collapse of the small cap stocks index in January and February. You can also see the recovery to today’s close. The 200 day moving average is still leading the market and the index did close above it, but the 200 day moving average should not be leading the index. The 50 day should be leading it and that is not happening. The 100 day is below the 200 and the 500 day is below both the 200 and 100 moving averages. This is “upside-down”. This is a negative sign for the Russell 2000 Index.
There has been a buy signal from the 20 day moving average when it crossed up and over the 50 day on March 10 and then the 100 day on March 29. The 20 day still needs more time to move above the 200 day which when it happens, will be a major buy signal on the Russell 2000 Small Cap Stocks Index.
Chart-wise then the index looks fairly solid going forward although there will be some periods of weakness and selling, but a sell-off down to even midway to the Feb lows, seems unlikely.
At present momentum is up, MACD is signaling down, the Ultimate Oscillator is signaling up, the Rate Of Change is quite positive with a reading of 4.38 and the Slow Stochastic is also signaling higher.

Russell 2000 Small Cap Stocks Index to Apr 13 2016
Russell 2000 Small Cap Stocks Index Outlook
At present the Russell 2000 appears headed higher. Technically there is only one downs signal and the remainder are all signaling higher. There cold easily be some weakness on Thursday and again on Friday, as outlined in the chart above but once that is over the TSX Composite Index should move higher. Looking at the technical indicators and the chart pattern, the small cap stocks index looks set to push still higher. I would expect no serious selling to emerge until sometime next week when by then the Russell 2000 index will be quite overbought. Any selling until then though, is a buying opportunity. Morning weakness on Thursday would be anticipated looking at the chart pattern this evening, but the close should see the Russell 2000 index still higher.
Disclaimer: There are risks involved in all investment strategies and investors can and do lose capital. Trade at your own risk. Stocks, options and investing are risky and can result in considerable losses. None of the strategies, stocks or information discussed and presented are financial or trading advice or recommendations. Everything presented and discussed are the author’s own trade ideas and opinions which the author may or may not enter into. The author assumes no liability for topics, ideas, errors, omissions, content and external links and trades done or not done. The author may or may not enter the trades mentioned. Some positions in mentioned stocks may already be held or are being adjusted.
Stay FullyInformed With Email Updates
Market Direction Internal Links
Profiting From Understanding Market Direction (Articles Index)
Understanding Short-Term Signals
Market Direction Portfolio Trades (Members)

