Intel Stock trades at a very reasonable 12.3 times price to earnings and even more impressive 6.8 times price to cash flow. No other company in the semiconductor industry can boast the revenue numbers Intel has. With $55.4 billion in revenue Intel dominates their industry.
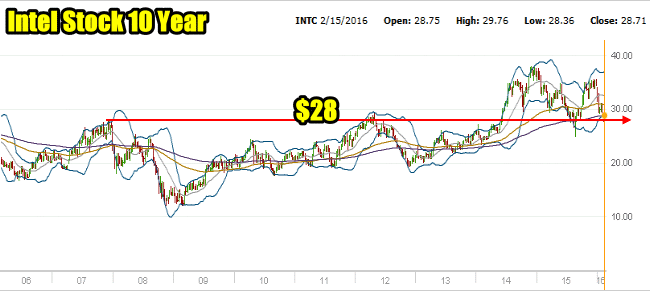
Intel Stock 10 Year Chart
My choice for strategy to use when trading against Intel Stock has been the Home On The Range Strategy. When you look at the 10 year chart you can understand why this strategy has been so successful. Intel Stock has been trading in a tight range for much of the past 10 years. The biggest drop over the period was the 2008 to 2009 bear market lows but in general the stock has stayed in a fairly predictable trading range making the Home On The Range Strategy ideal.
The price point I have been trading around for much of 2015 and now 2016 is the $28 to $29 valuation. While in 2015 the stock pushed to new 10 year highs, it failed to hold those highs and moved back to bottom out around the $28 valuation.

Intel Stock 10 Year Chart
Intel Stock 2016 Earnings Downgraded
This past week, 5 different analysts downgraded their expectations for earnings in 2016. Earnings estimates for the first quarter of 2016 which are reported April 19, are still at 49 cents which is a 19.5% increase over the same quarter last year. The second quarter which should be released around July 18 have been downgraded to .56 cents, just 1 cent more than same quarter last year.
The third quarter estimates have been dropped to an average of 66 cents, an increase of 3.2%. By the fourth quarter estimates now are for Intel to earn 71 cents per share, a drop of 4.05%.

Intel Stock Target Prices
Based on the price movement of the stock and the earnings momentum you can see in the chart above, analysts are mixed. Argus for example has a price target of $41 this year and a strong buy recommendation as well as overweight rating as of Jan 20.
S&P capital has a strong buy rating with a 12 month target of $39 as of a report from Feb 20.
A survey this past week of 38 analysts showed 80% have a buy rating on the stock and a consensus that Intel will surpass earnings estimates and surprise to the upside. The average 12 month target among analysts is $36.10 while a handful rated the stock a hold with a price target of $29.
Intel Stock Friday Feb 19 2016
I trade Intel Stock continuously and have done so for more than 10 years so I review all reports and ratings on Intel Stock. On Friday Intel Stock fell 2.41% to close at $28.71 having been unable to retake the $30 valuation level this week.
The 6 month chart below shows though that the stock has held the $28 valuation consistently over the past 6 months. On August 24 2015, in the market panic, Intel Stock sold down to a low of $24.97 and then within 4 days has recovered to the $28 level. In late September the pullback of the market again saw Intel Stock down at $28 which was also held. From there the stock moved higher pushing to $35.36 following good quarterly numbers on October 13.

Intel Stock 6 Month Chart To Feb 19 2016
Intel Stock In 2016
This year however, the stock fell back from the start of the year and reached $27.68 on Feb 11. This is a decline of 21.7% effectively placing Intel Stock in bear market territory. The inability of the stock to break back above $30 this past week and the pullback on Friday may be signaling that the stock will retest the $28 level and could break through. The next level of support in the stock is down at $25.oo to $25.50 which, aside from the August 24 panic, are prices not seen since spring 2014.
Intel Stock Trades For Final Week Of Feb 2016
For my trading purposes I will be continuing trading in Intel Stock even if it breaks $28 but for other investors they may want to hold trading until at least the start of the week to see if Intel Stock can hold the $28 valuation level. If it should break and fall to below $27.00 I will add shares or sell in the money put options as below $27.00 I think Intel is very good value.
Disclaimer: There are risks involved in all investment strategies and investors can and do lose capital. Trade at your own risk. Stocks, options and investing are risky and can result in considerable losses. None of the strategies, stocks or information discussed and presented are financial or trading advice or recommendations. Everything presented and discussed are the author’s own trade ideas and opinions which the author may or may not enter into. The author assumes no liability for topics, ideas, errors, omissions, content and external links and trades done or not done. The author may or may not enter the trades mentioned. Some positions in mentioned stocks may already be held or are being adjusted.
Internal Intel Stock Links
Members Only Articles On Intel Stock
Review 2013 Intel Stock Trades
Review 2012 Intel Stock Trades
Review 2011 Intel Stock Trades
Review 2010 Intel Stock Trades
All Intel Stock Posts With Excerpts

