The plunge of gold today, down $63.50 or 4% was followed by further declines after hours as the fall of gold to 1500 brought in a lot of selling after hours. Gold closed the day down a whopping $86.70 or 5.54% to 1477.60. Many investors are stunned. While after hours I watched and read a number of media articles about how this decline had been predicted by the “smart money” I don’t see it that way. I read very few reports on how the smart money was dumping gold until just the last few days. Indeed I read today that Billionaire fund manager John Paulson is down more than $300 million of his personal fortune due to his gold holdings. I am not an investor in precious metals and this article is an opinion piece. I own ABX Stock for options trading. It is the only mines and mineral stock I trade in.
Gold Enters Technical Bear Market
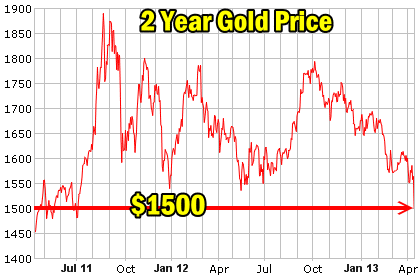
The collapse of Gold from the high of August 2011 when it reached $1888.70 on ounce (US$) on August 22 is now at 20.5% which technically marks a bear market. Looking at the 2 year chart you can see the support level at $1500 which a lot of analysts had pegged as strong support for Gold.
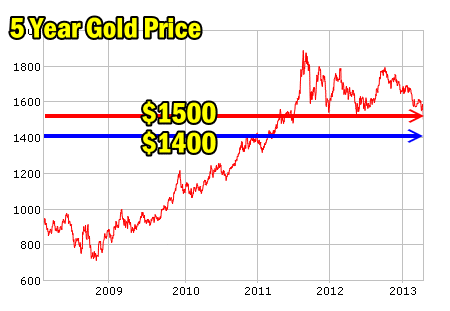
Gold Price 5 Year Chart
When you look at the 5 year chart on gold you notice something that perhaps a lot of investors in gold missed. From 2009 when gold was trading below $800.00 an ounce, the price of gold made a steady grinding move higher. This is also typical of a stock and an index that is in a long-term uptrend. But in 2011 the price of gold jumped and broke this pattern rising almost in a straight line as investors were convinced that the European crisis would be the undoing of the bull market in equities and the Euro.
Since then gold has followed a pattern of plummets, bounces and plummets again. This erratic type pattern is typical of the start of a bear market or at the least, a serious pullback as the rallies failed to recover the August high and the $1500 level was continually pressured on pullbacks. Only in the last pullback can you see that the decline was starting to become more extended or in simpler terms, no more spikes to try to recover the highs.
I am not a gold expert. Personally I see no value in this precious commodity as I prefer to trade within stocks and earn US Dollars or Canadian Dollars. I am a believer of paper currencies. I only own 1 precious metals stock, Barrick Corp (ABX) which I do options against, primarily put selling and I have been rolling them lower since Barrick Stock fell to $29.00. But I believe gold in August 2011 had entered the first stage of a blow-off in gold. Since then the price of gold has tried to rebound without success. I believe gold will move lower moving into the summer months and as it often seems to bottom in July, perhaps a interim bottom might be set. But I have no prediction other than following the chart pattern itself to determine when gold is back in a bull market again.
October 1980 – Inflation
I have been investing in equities since the early 1970’s and I enjoyed watching the “gold rush” of the late 1970’s to 1980, until the price of gold sky-rocketed in October 1980. Adjusted for inflation I have read reports that indicate the 1980 gold high would today be anywhere from $2500 to $5000 dependent on how inflation is calculated. No matter how you calculate it, the fear of inflation was the driving force behind the rise in the price of gold into October 1980. Back then as the Fed raised interest rates to attack inflation the price of gold fell. As it fell after Oct 1980, gold investors and analysts called for gold to shortly sky-rocket beyond the October 1980 high and a lot of investors bought into this belief. Instead gold tried a few failed rallies and then pulled back and sat in a bear market for over a decade.
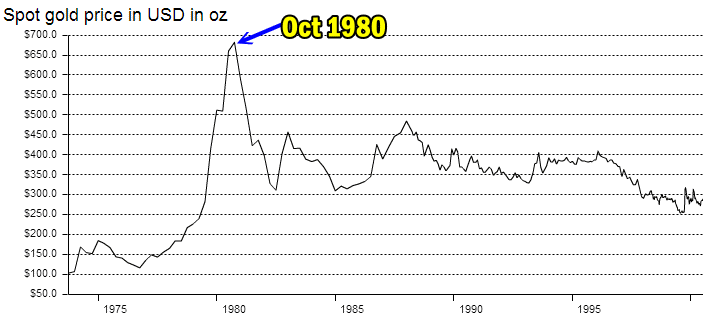
I believe just as in the 1980 top, the August 2011 top will end with a protracted bear market until the next perceived crisis arrives on the scene. The belief after the bear market collapse of 2008 – 2009 and the credit crisis was that the Federal Reserve printing of money would drive inflation resulting in gold reaching above $2000 in a matter of months. When inflation failed to materialize gold pundits wrote how the Euro collapse would drive up gold. When that failed gold bugs talked up the impending collapse of the US Dollar, under the weight of the money printing by the Fed. None of this has happened.
To date nothing the Federal Reserve has done has been inflationary enough to push gold prices “through the roof”. The buying of bond assets by the Fed is anything but inflationary. In many articles I have argued that the enormous debt burden of the developed nations of Europe and North America are such that historic low-interest rates may remain for longer than we think. In October 2008 when the TARP was launched to rescue US banks, I wrote that as an investor I would not be surprised if we were not entering a period of low-interest rates which could easily last 10 years as in the most basic of terms, the high debt levels could not be serviced through high interest rates.
One day our children may read that the period from 2008 to 2015 or even 2016 may end up being a historic period when we found that the enormous debt burden itself is so overwhelming that the printing of money ended without high inflation. No country to this point in history has had an economy the size of the United States. I would argue that no one can judge with any degree of certainty how the Quantitative Easing programs the Federal Reserve has engaged will stoke inflation. It is all conjecture on the part of both sides of the argument as it has never been tried.
Remember All The Jewelry Buying?
After gold’s incredible pullback after August 2011, gold bugs were writing constantly about the demand for gold by jewelers out of India and other countries and how the demand was “outstripping supply”. I knew that gold prices were in trouble when the final argument for higher prices that has been used a hundred times was suddenly back in print – “Gold is a finite commodity”.
The belief that because this precious metal has a finite limited supply is another reason to buy gold I think is unwarranted.
Japan Printing Money
Now Japan is following America’s lead and is cranking up the printing press convinced that the supposed hyper-inflation that so many economists predicted may not occur. Should this not help drive gold prices higher?
North Korea
The rumblings of war and missile tests from North Korea have also not push gold prices higher.
US Economic Picture
Overall the price of gold has had trouble since it appeared in fall 2011 that the US Economy might be improving and that the world’s economies were not about to collapse. In my opinion, it has been the growing strength of the US Economy in general that has pressured the price of gold.
Where Gold May Be Headed
I believe the collapse of gold will also be overdone to the downside which is typical of investors. There will be more selling now that $1500 an ounce has broken and there will be rallies, but until the next crisis of some magnitude appears on the horizon the price of gold will probably stay in a protracted bear market. I have no way of telling where the bottom of gold prices will be or when it will be reached or even if it may be almost there already. I do know that gold has always been overdone both to the upside and the downside.
Perhaps because I have invested for so long I have a different perspective on gold. I believe like every asset class, it is meant to be traded. It is not meant to be bought and held for the coming collapse of civilization or in the belief that hyper-inflation such as was experience in the Weimar Republic will be upon us. Instead gold is like everything else including paper currencies and equities. It is meant to be used for a purpose. That purpose in my opinion is to compound a portfolio and grow wealth. To that end even a simple measure of using a stop-loss would have saved many investors from what are fast becoming large losses.
The Value of Following Chart Patterns
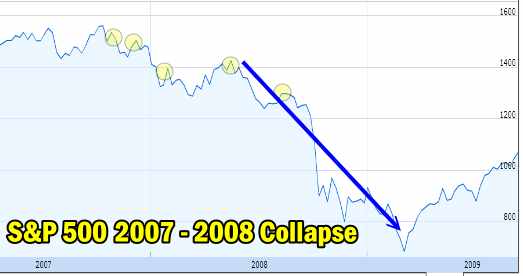
In the most simple of terms, following chart patterns can save investors a lot of grief. If investors had realized that by looking at a simple gold chart almost anyone could see that the price of gold was in trouble many may have acted sooner. The 2 year chart below shows the typical warning signs of an asset class under pressure. A series of failed rallies and then the gradual decline marked by lower highs and lower lows. Even precious metals and commodities follow patterns.
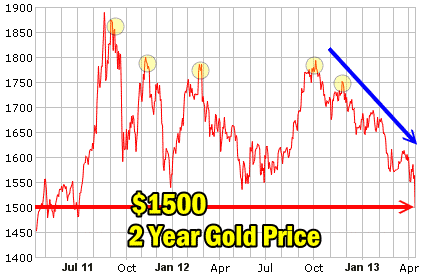
Watch For The Pattern
This pattern of failed rallies, and lower lows is so common that it is hard to believe that so many investors fail to catch it. The same pattern is in every type of asset class. Below is the S&P 500 collapse of 2007 to 2008. Once the pattern developed there was more than adequate time for investors to leave or put in place hedging strategies to protect and profit from a downturn.
Apple Stock Collapse
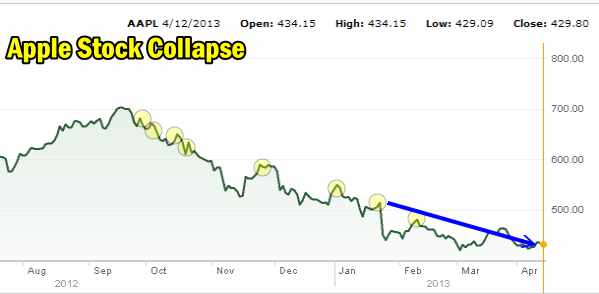
The collapse of Apple Stock was a shock for many investors and yet the same pattern was evident within weeks allowing investors ample time to get out or put in place hedges.
Time To Leave The Party
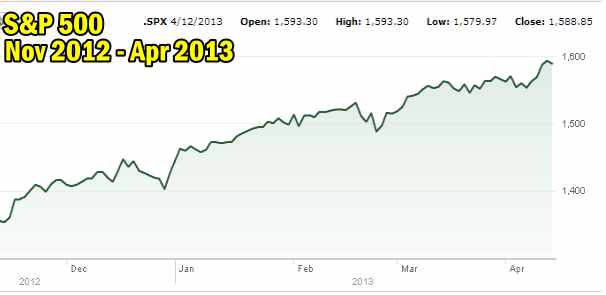
A simple reflection on a chart can advise investors when it is time to consider leaving. If not leaving then consider put protection or reducing positions. For example, eventually we will see the same pattern develop on the S&P 500 as this great bull market draws to an end. Just not yet.
Gold Sunshine Will Return
Gold will eventually have its day in the sun again and investors will once more enjoy spectacular returns but hopefully investors will consider my strategy. That precious metals are nothing more than an asset to be traded for profit. That the key is understanding by looking at a chart to know when to buy, when to consider a stop-loss, when to sell and when to short. Hopefully the collapse of the price of gold has told investors that nothing is concrete or guaranteed, that every asset has highs and lows and that these types of assets are called risky for a good reason.
Teddi Knight

