I watched a number of my favorite stocks, including Coca Cola Stock yesterday. The market collapse didn’t push Coca Cola options as high in premium as I wanted.
Today though was a very different story. The enormous wide swings in the market pushed down KO Stock and KO Options gained dramatically.
I came close to selling the KO Options for September $62.50 as they climbed to $2.10 or 3.3% in value for 1 month. But after 35 years of investing in some pretty wild markets, I realize that the better choice would be to examine the Coca Cola Stock chart and see what it can tell me, in an effort to pick an appropriate strike.
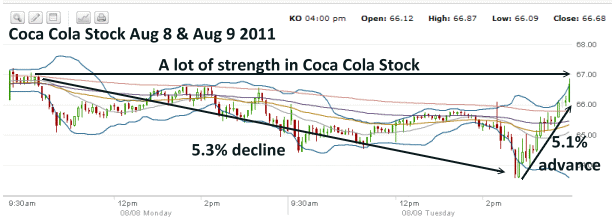
Below is Coca Cola Stock chart for August 8 and August 9 2011. I watched the stock all day yesterday during the market collapse and KO Stock held up quite well. Today, August 9, the stock rose until mid-afternoon and then it fell hard. I believe probably a lot of computer trading going on with the stock when it fell below $64.50 as the volume picked up dramatically.
I watched trying to decide which put to sell for September. The $62.59 KO Option put was very tempting at $2.10 but in the end I went for the September $60 Coca Cola Option.
Before moving to the next chart, it is exciting to see such volatility in KO Stock while at the same time a lot of strength. This is a great stock for my investing style.
Coca Cola Stock – Picking The Appropriate Strike
While the $62.50 strike was so appealing, it is important to remain aware of the market conditions. Today’s rally could easily be just a “dead cat bounce” and shortly selling could resume. While I have earned $22,000.00 in capital within Coca Cola Stock since October 2010 and I could easily consider being put shares at $62.50, my strategy works because I am consistent.
It is the consistency of studying charts, and staying with a strategy that stresses a 1% per month income along with a large degree of safety, that has made my investing successful for the past 35 years.
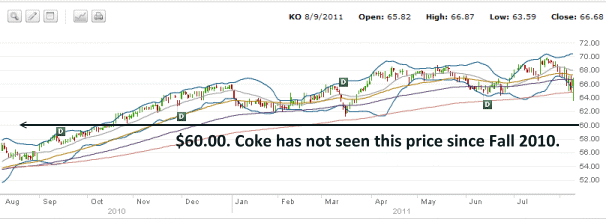
Therefore looking at the Coca Cola Stock chart below for the past year, I can see that while $62.50 is certainly a low spot for the stock, $60.00 has not been reached since the fall of 2010. All this year Coca Cola Stock never reached $60.00.
Therefore if KO Stock fell below $60.00 not only would I not mind being assigned, but I would have a very good opportunity to possibly roll even lower. As well the $60.00 Coca Cola option put strike being sold for $1.10 made more than my minimum goal of 1%. Therefore I sold the put.You can view the Coca Cola Option trade here. Remember to scroll down to today’s date.
Coca Cola Stock – Summary
By having clear goals and learning the movements of my favorite stocks, it is much easier to sell puts and sell calls against them. Since my goal is always 1% for the month, it was a simple matter to sell the KO $60.00 put option. In the event that the market continues to sell lower, you never know, but perhaps my 1% goal may save my position from being assigned and allow me to sell further puts for the next month without yet taking assignment of any shares.
This is the ultimate goal of my Coca Cola Stock trade.


