Recently I wrote an article in which I looked at Amazon Stock after its recent pullback to see if it was a buy. I received a number of emails from readers wondering if I thought Apple Stock would be better for selling puts against versus Amazon Stock. I took a look and was surprised by what I saw. Amazon stock is very strong which is surprising considering that today it is trading at 113 times Price To Earnings. That type of multiple is very rare in tech stocks today. If the next quarter should show slow revenue growth again, the stock could easily tumble.
AMAZON STOCK VS APPLE STOCK – The Charts
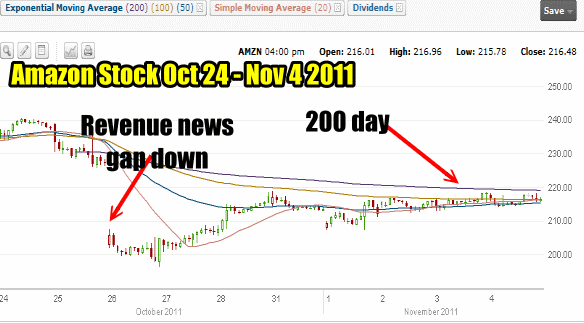
Amazon Stock Chart Oct 24 – Nov 4 2011
The past 10 days in Amazon Stock is shown below. The gap down on the revenue news is pretty clear. At some point this gap should be filled which could mean a rise in the stock price before more selling. The stock is hovering around the 200 day exponential moving average (EMA) after falling below it on the revenue news.
Still Amazon stock has pulled back up from the Revenue News drop and closed today at $216.48. Not a bad recovery so far and the stock could try to get back to $230.00 before more selling pushes it back down. Investors will be nervous with Amazon stock until they see the next quarter revenue numbers. That should keep a lid on Amazon stock until then so I would think the upside is fairly limited.

Amazon Stock From oct 24 to Nov 4 2011
Apple Stock Chart – May to Nov 4 2011
Apple stock has also had a bit of problem with earnings when it missed analysts estimates in the most recent quarter. Many analysts felt that it was the delay of their latest iPhone that hurt earnings and it may well have been.
The Apple stock chart below gives me a lot of information. First, I can see that each rise in the stock has created higher highs. This is a sign of a stock in a bull market of its own. Even the Oct 4 lows for the stock have been erased but the earnings news gap down for Apple Stock has yet to be recovered.
The stock has held above the 50, 100 and 200 day moving averages (EMA – exponential moving averages) which is again a sign of a bull trend in the stock. The los for the stock easily broke the 50 day but the 100 day held up very well in the selling of the last few months.
Overall the stock appears in good shape and if it should pull back below $380.00 I would be selling the $360 put. For investors who prefer to buy the stock for a rebound, any move of the stock below $370.00 would have my interest in buying the stock for a bounce back above $400.00.

Apple Stock Chart May 4 to Nov 4 2011
Amazon Stock VS Apple Stock – What Are The Fundamentals
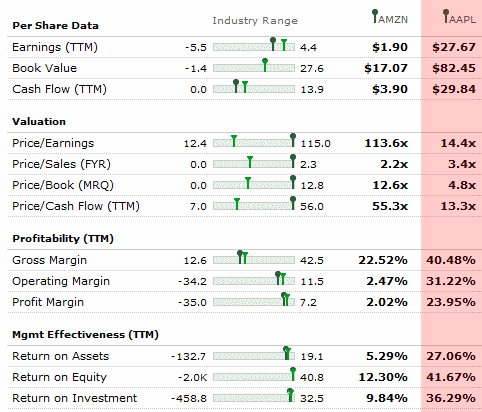
The following chart looks at the fundamentals of both Amazon Stock and Apple Stock as of November 4 2011. On a per share basis everything is in favor of Apple Stock and not by a small margin. The fundamentals of these stocks is as different as night and day.
Apple has the kind of fundamentals that are supportive of the stock and it moving higher. Apple stock is trading at just 14.4 times price to earnings while Amazon stock is at 113.6 times. Book value of Apple Stock is $82.45 versus $17.07 for Amazon Stock.
Gross profit margins are almost double for Apple Stock, but operating margin and overall profit margin are astronomically higher for Apple Stock. Last Management effectiveness is again deep on Apple Stock’s side.

Amazon Stock VS Apple Stock - Fundamentals Chart as of Nov 4 2011
So far the stock charts and Fundamentals favor Apple Stock over Amazon Stock for investors interested in selling puts. Last let’s look at stock option put premiums.
Amazon Stock VS Apple Stock – Option Premiums
Below are the put option premiums for December 2011 expiry as of November 4 2011. To decide which stock is better for selling puts, I normally would select the strike that I would be most comfortable owning the stock at, should I end up being assigned shares.
In my recent article on Amazon Stock I mentioned the $180 put strike as the strike of choice if I wanted to sell puts against Amazon Stock. The $180.00 could be sold on November 4 2011 for $2.03 or a return of 1.12%. With Amazon Stock closing on Friday at $216.48 the $180 put offers 16.85% protection. With Amazon stock announced its recent quarterly results the stock fell 14%. Therefore 16.85% seems like decent protection for a little over a month of risk.
For Apple Stock I mentioned $370.00 in my analysis above, as a price point where I would consider owning shares. The Dec 370.00 Apple Stock put could have been sold for $5.60 for a return of 1.51%. On Friday Apple Stock closed at $400.24 so selling the $370.00 put offers just 7.5% downside protection, however when Apple Stock was hit with the last quarterly earnings disappointment the stock fell 5.59% so 7.5% downside protection may indeed be enough for what is again a little over a month of risk.

Amazon Stock VS Apple Stock Dec 2011 Contract Put Option Premiums as of Nov 4 2011 Closing
AMAZON STOCK VS APPLE STOCK – Which Would You Choose?
When selling puts against a stock you must ask yourself if you would own that stock should the trade not work out and you are assigned shares. Looking at the above chart patterns, fundamentals and put option premiums I would sell Apple Stock puts and leave Amazon alone. But that is my choice based on looking at the charts and realizing that Apple Stock is in what appears to be a long-term uptrend. Amazon Stock should it disappoint in the next quarter again could very well pull back dramatically. Any stock trading at such a high price to earnings has a lot of room to fall. Apple stock on the other hand looks like a buy should it fall below $380 and below $360 it looks like a strong buy. If you have a comment please use the comment fields below to tell other readers which stock you would choose, Amazon Stock or Apple Stock.

