Javascript DHTML Drop Down Menu Powered by Drop Down Menu
FullyInformed.com - Options and Stock Strategies For Income

SignUp For Updates 

  You are here:


Bookmark and Share
 

YUM!
BRANDS
 
About The Company

Yum Brands controls 5 different concepts. KFC, PIZZA HUT, TACO BELL, Long John Silver and A&W. YUM Brands now has 36,000 restaurants in 110 countries and continues to open more outlets every month.

Through the five concepts of KFC, Pizza Hut, Taco Bell, LJS and A&W (the Concepts), the Company develops, operates, franchises and licenses a worldwide system of restaurants, which prepare, package and sell a menu of food items. The Company either operates units or they are operated by independent franchisees or licensees under the terms of franchise or license agreements.

In addition, the Company owns non-controlling interests in Unconsolidated Affiliates in China who operate similar to franchisees. YUM's business consists of three segments: United States, YUM Restaurants International (YRI) and the China Division. The China Division includes mainland China (China), Thailand and KFC Taiwan, and YRI includes the remainder of its international operations.

McDonalds has a market cap of 60.91 Billion. Yum Brands is now at 15.64 Billion and growing faster than McDonalds. Every year Yum Brands has increased its market cap. It is now 25% as large as McDonalds. It is definitely a large cap player and will be around for quite some time. While I am not interested in owning this stock, I don’t expect any kind of dramatic sell off in the stock.


TOP 10
READ
ARTICLES


Clorox Call Options Go Through The Roof


Using Moving Averages For Profits In Cisco Systems Stock


Early Warning Tools To Spot A Collapsing Stock


Using The Spy For Hedging During Downturns


Applying The Strategy Of The Cautious Bull


Greek Debt Crisis - Investors Unprepared


Dividend Stocks The Cut Dividends


Microsoft - The Ultimate Utility Stock
Better Than Gold


How I Treat My Investing Like A Business


Charities Are An Industry


  YUM! BRANDS  (YUM) - 2011
ONGOING EVALUATION & TRADE
My goal for YUM is to collect income from naked put writing. When the stock gets over-valued (in my opinion) I will revert back to selling laddered naked puts to keep myself below the stock price to try to avoid being assigned at a too high a level. Should I get assigned I should be able to sell the stock through covered call writing as I will be in the low range for this stock. Yum's chart looks promising for selling naked puts consistently.
YUM TRADES BY YEARS
VIEW YUM-2011 TRADES
VIEW YUM-2010 TRADES
VIEW YUM-2009 TRADES
ALL
PORTFOLIOS
INDEX
U.S. STOCKS
RETIREMENT PORTFOLIO
CANADIAN STOCKS

 
CURRENT U.S.
STOCK PORTFOLIO
INDEX

AT+T
CLOROX
COCA COLA
INTEL CORPORATION
JOHNSON & JOHNSON
KRAFT FOODS
MCDONALDS
MERCK & COMPANY
MICROSOFT
NUCOR CORPORATION
PEPSICO
SPYDER ETF
VISA
EXXON MOBIL
YUM! BRANDS


Should you find my strategy and ongoing evaluation of this trade of value I hope you will consider a tip for the time I spend detailing out this trade. I have set up a Paypal account for those who would like to donate. Thank you in advance. Remember, nothing on my site is financial advice. They are just my ideas and opinions. Investing is risky and losses can be large. Trade at your own risk. Read the terms of use


YEAR 1: 2009 - Trade Commenced Aug 11 2009
Goal for 2009: 5% (5 months)
Strategy: Sell Naked Puts Until Assigned
 
Capital In Use At End Of 2009 30,000.00
Income Earned in 2009 (5 months) 1,397.25
Return On Capital in 2009 (5 months) 4.6%
   
YEAR 2: 2010
Goal for 2010: 12%
Strategy: Sell Naked Puts Until Assigned
 
Capital In Use At End Of 2010 45,000.00
Income Earned in 2010 5964.00
Return On Capital For 2010 13.25%
   
YEAR 3: 2011
Goal for 2011: 12%
Strategy: Sell Naked Puts Until Assigned
 
Capital Currently In Use 55019.50
Income Earned in 2011  6863.50
TOTAL INCOME EARNED TO DATE 14224.75
Total Of My Own Capital Required 40794.75
Number Of Shares if assigned 1000
Share Price Valuation
(Total Capital Required/Number of shares)
40.79

YEAR - 3:  2011
TRADE COMMENCED Aug 11 2009
GOAL FOR 2011: 12%

ONGOING STRATEGY - SELLING NAKED PUTS UNTIL ASSIGNED

* ACTIVE TRADES ARE HIGHLIGHTED IN YELLOW

    CARRY FORWARD FROM 2010               7361.25
Jan 31 11 46.40 BTC 10 Naked Puts Feb 46 @ 1.12     19.50     (1139.50) (2.48) 6221.75
Jan 31 11 46.40 STO 10 Naked Puts Mar 46 @ 1.75     19.50   46019.50 1730.50 3.76 7952.25
Jan 31 11 46.40 Bought 500 shares of YUM at $46.40 500 46.41 7.00 23,207.00 23,207.00      

Jan 31 2011: Normally the fact that YUM has fallen below the last two recent lows would indicate to me that this stock is going to fall further. However the oscillator tells me that the stock is going to bounce. I bought  500 shares and I rolled from Feb to Mar at the 46.00 strike for my naked puts.


Feb 18 11 51.10 Sold 500 shares of YUM at $51.10 0 0 7.00 (25543.00) 0 2336.00 10.0 10,288.25

Feb 18 2011: It's been a quick run up but the oscillator is warning of an overbought condition. I sold my 500 shares on today's weakness.

Mar 18 11 51.00 Expiry: 10 Naked Puts Mar 46 expired               10288.25

Mar 23 2011: The stock has moved sideways but the pressure to the downside is not strong. The oscillator shows the stock is sitting neutral.


Mar 23 11 50.50 STO 10 Naked Puts May $48.00 @ .80     19.50   48019.50 780.50 1.63 11068.75
Apr 12 11 49.90 STO 10 Naked Puts Jun $48 @ .88     19.50   48019.50 860.50 1.79 11619.25

Apr 20 2011: COMPARING YUM BRANDS and MCDONALDS


After hours, the earnings came out on YUM. They are up 7% or .63 cents a share before a special one time cost which reduces the earnings to .54. YUM's earnings continue to get good but here is why I prefer my strategy over owning any shares. I am sure earnings like those today will jump the stock higher for a while and might even set a new higher trading range, but overall I prefer to be on the cautious side. The earnings for the past 5 quarters are below. As long as the earnings can stay above last year, then YUM will trade higher or at least in a higher range, but earnings from the US were down. Overall just 1%, but it shows the weakness of the world's biggest economy. In the US not only is there more competition, but the cost of food is being reflected in the declining US dollar. Meanwhile earnings outside the US and in particular Asia are very good, up 18% in China and 5% worldwide. This is excellent news, but lets look first at 
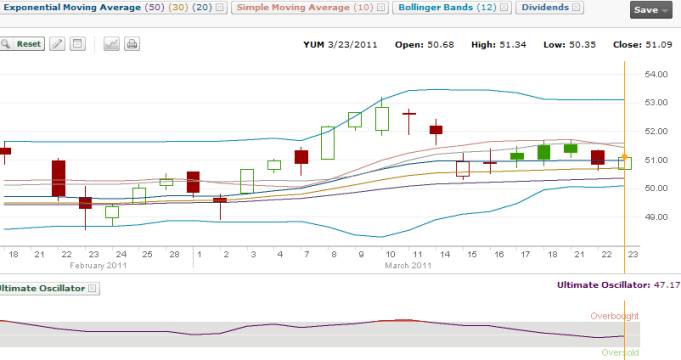
the chart below. Since March's earnings YUM stayed sideway until September when YUM turned in a stellar performance and the forward looking statement promised more growth. The Dec earnings of .63 cents was good but not quite what a lot of investors believed after September's earnings. The stock pulled back from Dec through to Feb and despite the market itself moving higher into Feb 2011, YUM moved to a low on Feb 24 of $48.67. But while the earnings were good after hours, overall the earnings of .63 cents matches December's. 
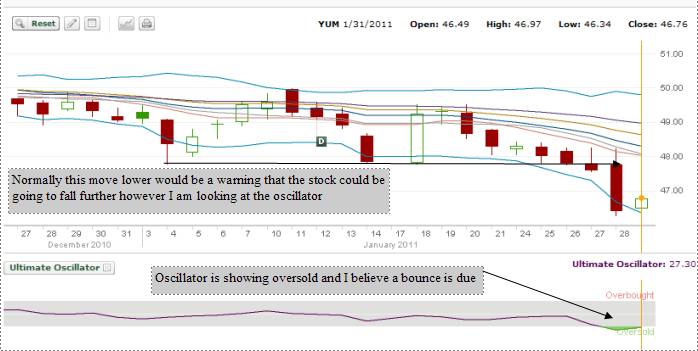
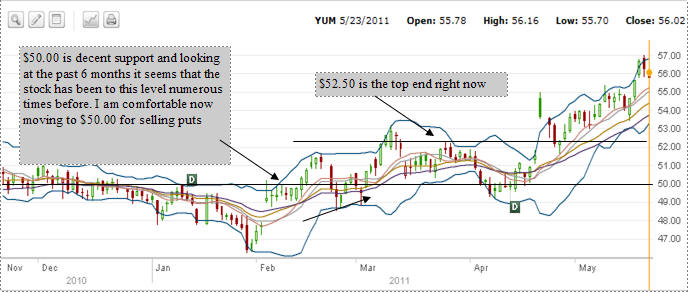
The lower Bollinger is my key to when this stock may set a new trend. I have set my trading range between the upper Bollinger from the previous range and the lower Bollinger from the most recent move, around the $48 strike.


Once the lower Bollinger holds for a few months and can confirm a move to a higher trading range then I will move up, but until then every move to the lower Bollinger should give me the opportunity to sell more naked puts within my range. 


Meanwhile here is how I view both YUM and the other large restaurant stock, McDonalds.

Now here is a comparison chart of both companies. The larger gain in YUM is evident plus YUM has set two new higher highs. Meanwhile McDonalds has failed to set a new high since December of 2010. This is the reason for the larger return on equity and return on investment for YUM. Meanwhile though McDonalds has a better dividend, much better debt to capital ratio, lower PE, better earnings, cash flow and of particular interest book value. However the market cap is much larger for McDonalds but revenue is much better at YUM. The two charts below show that both have decent trading ranges. I find both stocks are excellent for selling naked puts. Earnings continue to support a decent trading range for both stocks particularly watching the lower bollinger.

SUMMARY:
Both  YUM and McDonalds have been excellent stocks for my portfolio. Recent earnings from YUM show good growth outside the US, and while analysts talk up the stock, I tend to look at it more for its range. At .63 cents the recent quarter matches December and does beat last year's same quarter. However could the stock be ahead of itself? The PE is higher on YUM than McDonalds, debt is larger, book value less, but on the other hand YUM has provided a better return on equity and investment for shareholders and has set two new highs since Nov 2010. I always take a different approach to stocks and both of these are good examples. For my strategy of selling naked puts I am seeking stability of price  and a trading range rather than being concerned about the stock climbing higher. In fact, a higher priced stock often increases the risk of the stock pulling back in any selling and could catch my naked puts and put me in the money. Unless earnings can justify a higher PE often a run-up can be just as quickly followed by a run-down.

When I sell naked puts they are often at risk of assignment for 30 to 60 days. A range bound stock though, gives me some idea as to what the future could hold and what the high and low areas of the stock could be. While its a judgment call as to where the stock might go, I have some "crystal ball" through the Bollinger bands. So when the stock moves to the lower bollinger I can sell my puts and when it moves up I can buy them back. However, if I am wrong and the stock pulls back too far, and I get assigned before I actually wanted the shares, at least I am in a stock that has met all my parameters, including dividend, reasonable PE, large cap, solid earnings, increasing dividend.

Any investor could take this same concept and apply it to stocks they follow. The trick is having faith in the stock and in the technical analysis they do in order to have comfort in the price strikes they choose.

Apr 22 11 53.60 BTC 10 Naked Puts 21MAY11 48 @ .05     19.50     (69.50) (0.144) 11549.75
May 20 11 56.00 BTC 10 Naked Puts 18JUN11 $48 @ .05     19.50     (69.50) (0.144) 11480.25

May 23 2011: YUM BRANDS AGAIN


A month ago I wrote (April 20th above) that YUM needs to prove a new range for me to consider selling puts higher than $48.00. Looking at the past 6 months the stock has been to the $50.00 strike numerous times. This would indicate to me that $50.00 should have enough support that I can sell it a couple of months out and not be too worried about being assigned. With the stock having pulled back for two sessions, I will start with 5 put contracts and wait to sell the other 5 in case there is a pull back lower.

May 23 11 56.02 Sold 5 Naked Puts 16JUL11 $50 @ .42     13.25   25013.25 196.75 0.78% 11677.00
Jul 15 11 55.51 Options Expiry: 5 PUTS 16JUL11 $50 expired                

Aug 8 2011 YUM RETURNS TO MY PUT PORTFOLIO!


Today's massive selling has seen the return of YUM! Brands to my naked put selling strategy! I am thrilled to see YUM Stock back to my portfolio!


YUM Brands Stock Chart - August 8 2011

Aug 8 11 47.90 Sold 5 Puts 17SEP11 $45 at 1.25     13.25   22513.25 611.75 2.7% 12288.75
Sep 16 11 53.85 Expiry: 5 Puts 17SEP11 expired                
Sep 19 11 50.90 Sold 5 Puts 22OCT11 $47 @ .95     13.25   23513.25 461.75 1.9% 12750.50
Sep 19 11 50.50 Sold 5 Puts 22OCT11 $45 @ .62     13.25   22513.25 296.75 1.3% 13047.25
Sep 29 11   Today YUM Stock collapsed over 7% on worries out of China. Read the steps I took to determine whether to stay in YUM Stock or to leave it.                
Oct 21 11 53.74 Expiry 5 Naked Puts Oct $47 expired
5 Naked Puts Oct $45 expired
               
Nov 23 11 53.20 STO 5 Naked Puts 21JAN12 $45 @ .60     13.25   22513.25 286.75 1.2% 13334.00
Nov 25 11 52.80 STO 5 Naked Puts 21JAN12 $47 @ .84     13.25   23513.25 406.75 1.7% 13740.75
Dec 20 11 58.12 STO 10 Naked Puts 21JAN12 $55 @ .56     19.50   55019.50 540.50 1.0% 14281.25
Dec 27 11 59.00 BTC 5 Naked Puts 21JAN12 $45 @ .02     13.25     (23.25)   14258.00
Dec 27 11 59.00 BTC 5 Naked Puts 21JAN12 $47 @ .04     13.25     (33.25)   14224.75
                     
YUM TRADES BY YEARS
VIEW YUM-2011 TRADES
VIEW YUM-2010 TRADES
VIEW YUM-2009 TRADES


Disclaimer: There are considerable risks involved in all investment strategies. Trade at your own risk.
Stocks, options and investing are risky and can result in considerable losses. None of the strategies, stocks or information discussed or presented are financial advice, trading advice or recommendations. Fullyinformed.com is a private website. Everything presented and discussed are the author's ideas and opinions only.
By using this site, you agree to be bound by its terms of use. The full terms of use can be read here. If you do not agree to the terms of use, do not use this site. The author of fullyinformed.com assumes no liability for topics and ideas discussed, errors and omissions, ads and their content and external links. Any corporate insignia used are registered trademarks of their respective company or corporation and are being used for identification purposes only. All material copyrighted by FullyInformed.com. Reproduction in whole or in part prohibited. Copyright © 2008

 |  site map  |  privacy policy  |  contact me  |  subscribe  |  exchange links  |  the author of fullyinformed  |